


The current structure of the EURJPY pair shows a large uptrend that moves within the green channel. On the current chart, we see the price movement from mid-May to the present day.

In mid-May, the price touched the lower green line, then pushed off from it and we saw an increase in the value of quotations. After the price touched the upper line of the green channel, the price turned around and began to move to the lower green line within the yellow channel.
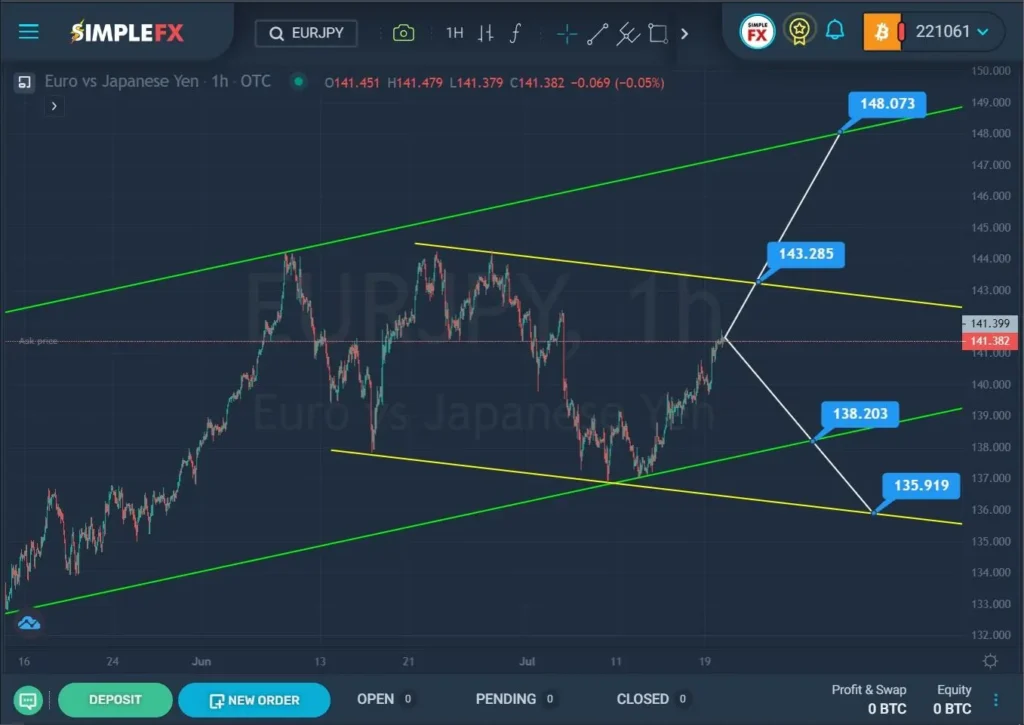
In the last section of the chart, we see a price increase from the lower green line in the direction of the upper yellow wall. Currently, the market is located near the yellow line. It is assumed that after the breakdown of the resistance level of 143.28, we will see a longer bullish movement of the currency in the direction of the next critical resistance level of 148.07, which is located on the upper green line.
Alternatively, the price may start to decline before reaching the yellow resistance line. Perhaps the bears may try again to break through the support line of the green channel near the level of 138.20. If this level is broken, the price may fall to the next support level of 135.91, located on the yellow channel’s lower wall.


