


The current formation of the DJI30 index shows the development of a global bearish trend that is moving inside a sizeable green channel. The current chart shows the price movement since the end of April.

At the end of April, the bulls reached the upper green line but did not break through it. After that, the market crept down. The price reached the lower green wall in the second half of June. The bears did not break through the lower support line of the green channel, so the market turned around and began to move in the opposite direction within the ascending yellow channel. The price touched the lower yellow wall a few days ago but did not break through it. The market, having pushed off the yellow support line, began to increase.
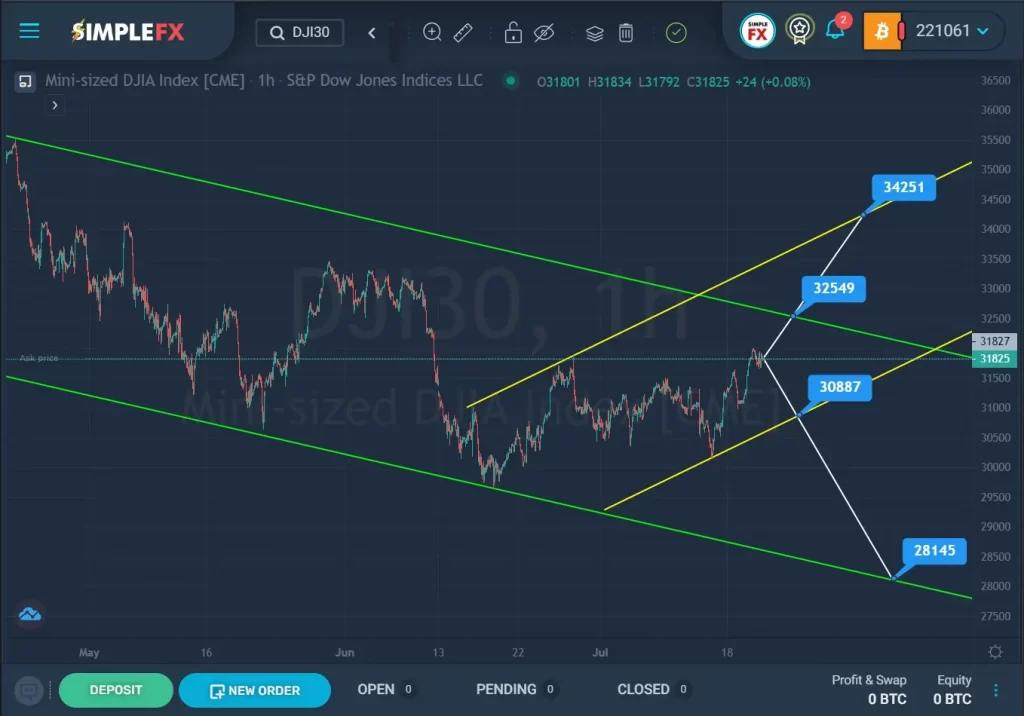
Most likely, the bulls are targeting the resistance level of 32549, located on the upper green line. If this level breaks, the index may rise to the resistance level of 34251, located on the yellow channel’s upper wall. In the current situation, it is possible to consider opening long positions.
Alternatively, a downtrend is expected to develop, which will move toward the lower yellow line. Perhaps if the bears can break through the support level of 30887, the downtrend will be confirmed. In this case, market participants will be waiting for the continuation of the downward price movement to the next support level of 28145, which is located on the lower green line.


