


The current formation of the USDCHF currency pair hints at the construction of a downward trend that moves within the sizeable green channel.
On the current chart of the 1H timeframe, we see that since the end of May, the price has been zigzagging from the upper green line to the lower green line. The last upward price movement from the lower green wall describes the yellow channel. The bears did not have enough strength to break through the support line, so the bulls entered the market.

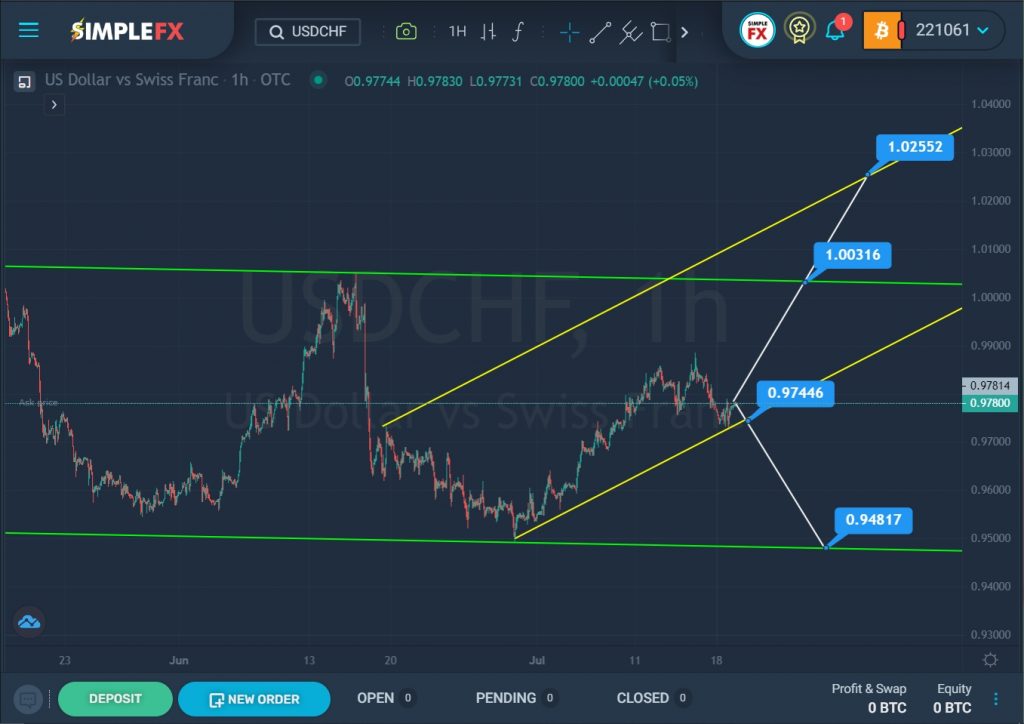
We see that the price reached the lower yellow line not so long ago, and now the price is held by the yellow support line. If this line is not broken, the uptrend will continue. It is assumed that there will be a repeated upward movement to the upper green wall and the resistance level of 1.003. With a successful breakdown of this level, the USDCHF pair may rise to the level of 1.025, located on the lower yellow line. In this case, we can consider purchases.
Alternatively, we can expect a breakdown of the support level of 0.974. In this case, traders can expect a market fall in the direction of the lower green wall and the next important support level of 0.948. In this case, sales can be considered.
An approximate scheme of possible future movement is shown on the chart.


