


The EURGBP currency pair shows the formation of a bullish trend that moves within a large green channel. The downward movement of the price in the last section of the chart, which began in mid-June after a pullback from the upper green line, describes a smaller yellow channel.

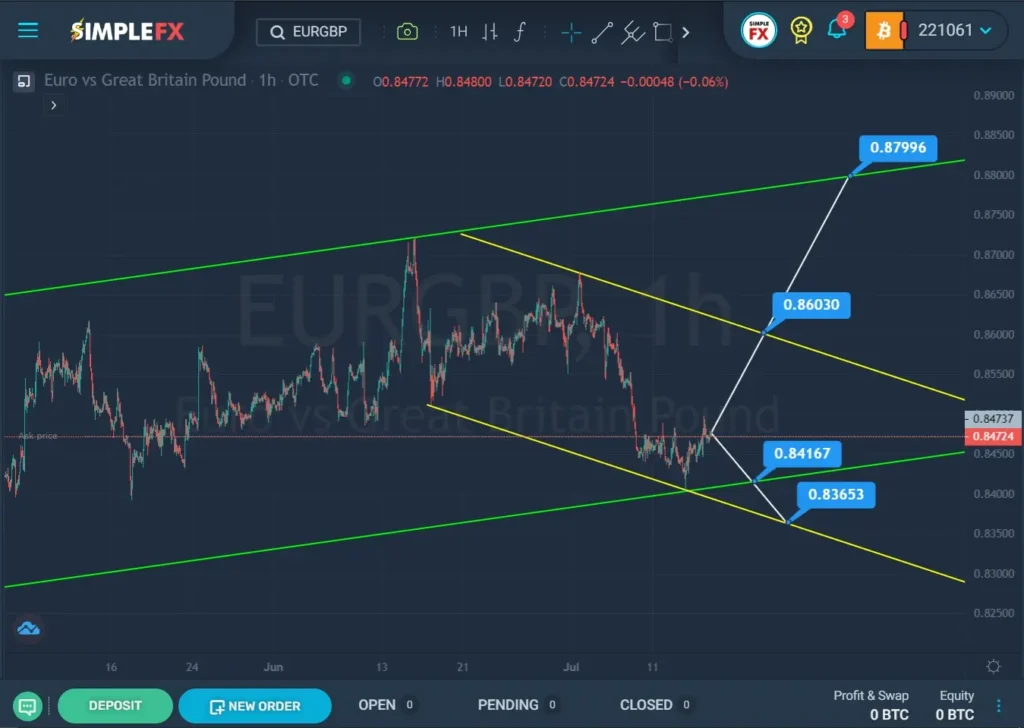
If the price rises in the next coming days and the upper line of the yellow channel and the resistance level of 0.860 are broken, we can see a gradual increase in the price in the direction of the upper wall of the green channel and the resistance level of 0.879 located on this wall.
However, if the bulls do not have enough strength to push the price up and break through the yellow line, we may see a continuation of the bearish trend and a decline to the lower green wall, and then a breakdown of the support level of 0.841, which is located on this wall. By the way, the bears were already trying to break through the green line not so long ago. With a successful breakdown of the support of 0.841, market participants may expect a decline in the direction of the lower line of the yellow channel and the support level of 0.836.
A possible scheme of the future price movement is schematically shown on the chart.


