


Today we will consider the situation for the LTCUSD cryptocurrency. Its current structure in the 1H timeframe shows the formation of a downward trend that moves within the green channel.
Throughout April, the price gradually moved down in the upper green area. This section of the chart describes a bearish yellow channel. The price began to fall more rapidly after the rebound from the upper yellow wall.
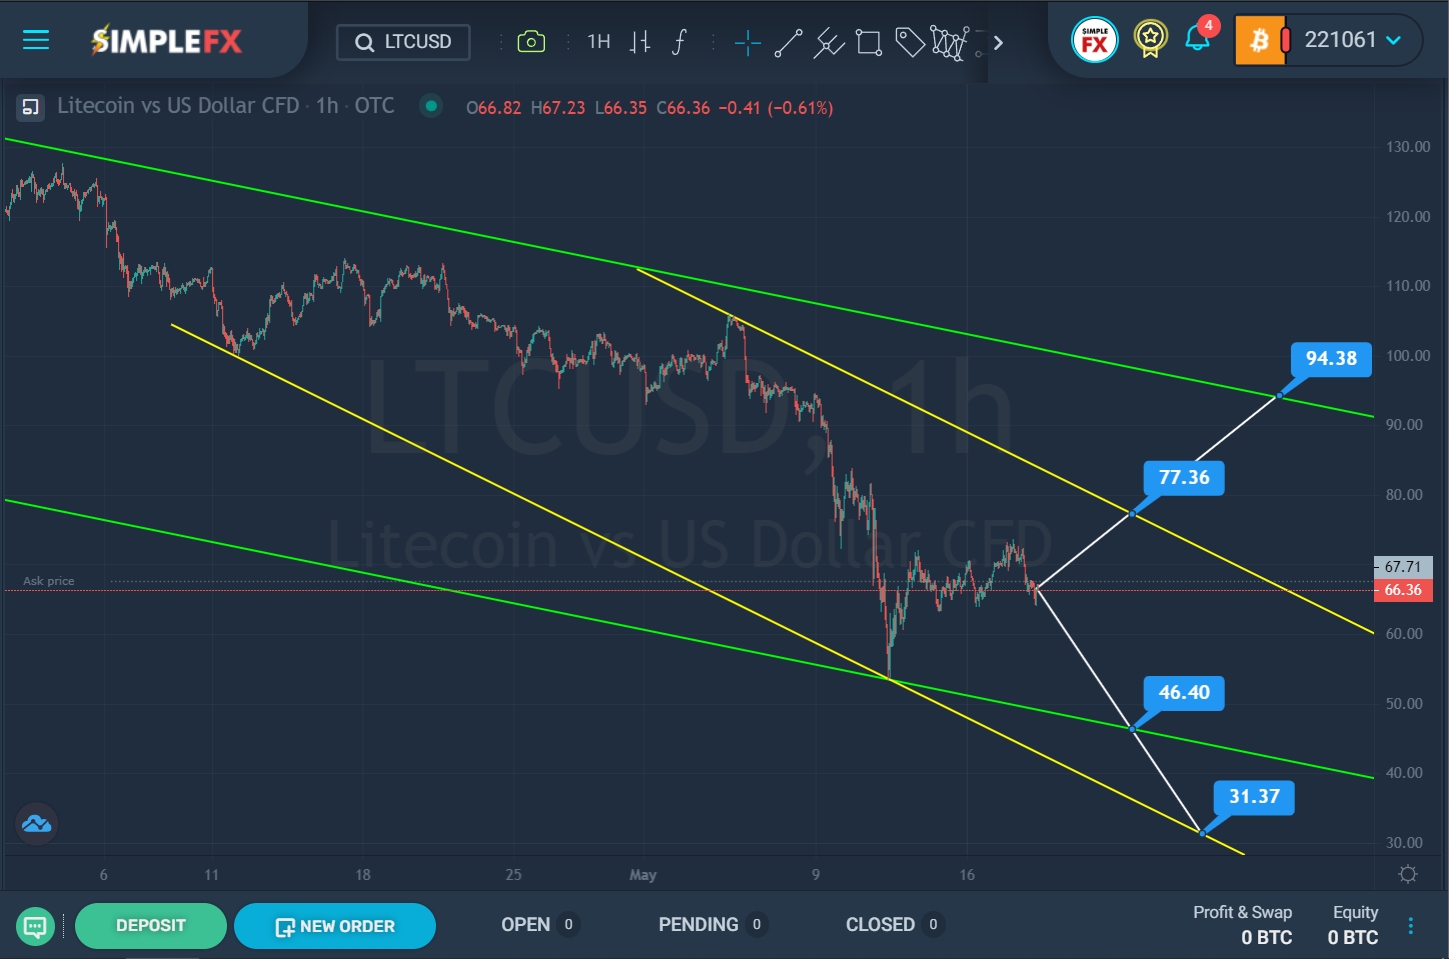

SimpleFX LTCUSD Chart Analysis: May 19, 2022.
Perhaps the bearish trend will continue in the next coming trading weeks. If we look at the last section of the price movement, we can see that the bears have already made an attempt to break through the lower green wall at the intersection with the green line.
There is a chance that the green support line will be broken on the second attempt. Thus, with a breakdown of the support level of 46.40, the fall of the cryptocurrency can be continued to the lower yellow line and the support level of 31.37.
Alternatively, it is assumed that the last rebound from the two lower walls of the yellow and green channels can serve to form a bullish trend. If the upper yellow line breaks down near the resistance level of 77.36, the growth may continue to the next important resistance level of 94.38, which is located on the upper green wall.


