


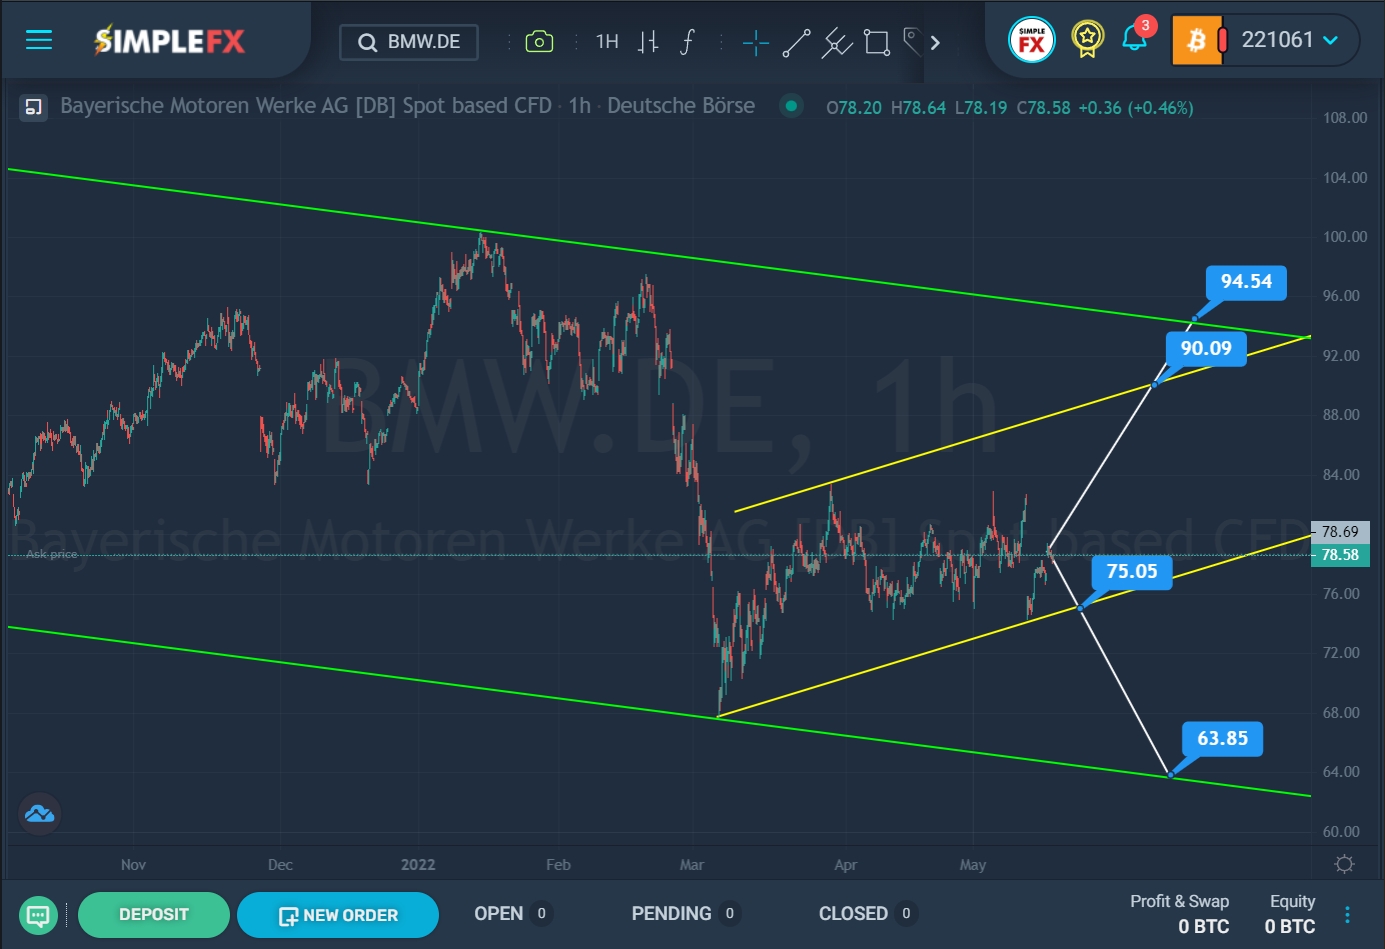
The current BMW.DE chart shows the formation of a global downtrend that moves within a large green channel.

SimpleFX BMW.DE Chart Analysis: May 18, 2022
Until mid-January, the price steadily rose from the lower green line to the upper green line. Then it reached the upper green wall, after which it pushed off from it and began to move in the opposite direction. After the bears entered the market, the price dropped to the lower green line in less than two months. After that, it pushed off from the lower green wall and began to grow rapidly within a small yellow channel.
Now the price is near the lower yellow wall. Perhaps soon the bears will bring the price to the support level of 75.05, located on it. With a successful breakdown of this level, the price of BMW.DE shares may fall again to the support level of 63.85, which is located on the lower green line.
Alternatively, the price may start to rise from the current level, or from the support level of 75.05. A bullish trend may form inside the yellow channel in the direction of its upper wall and the resistance level of 90.09. If this price mark is broken, even greater growth of the stock is possible to the next resistance level of 94.54, which is located on the upper green line.


