


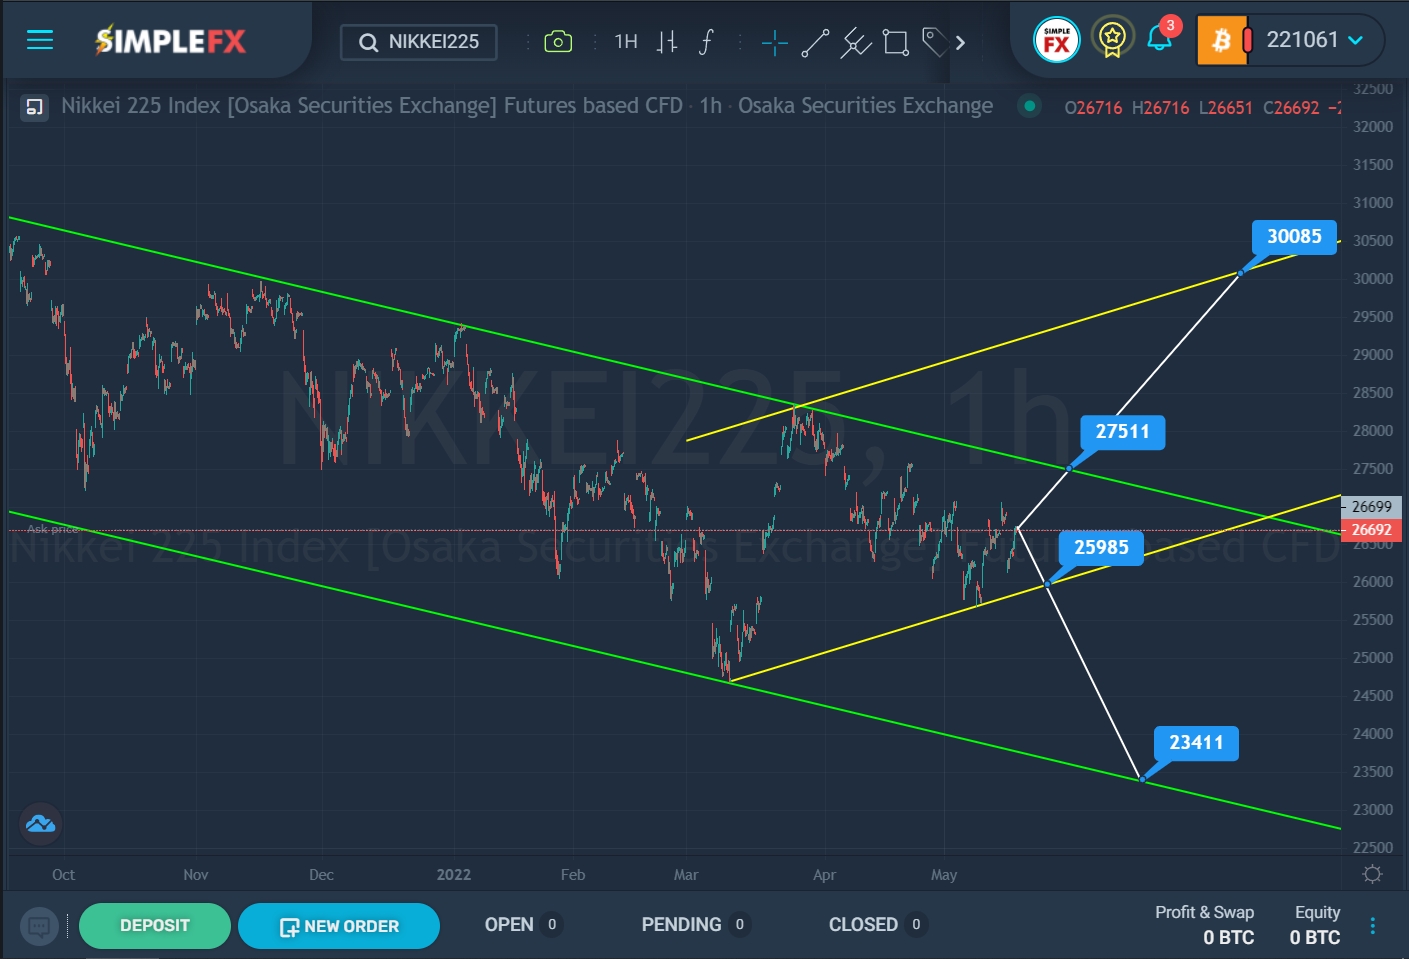
The current NIKKEI225 structure shows the development of a downtrend that moves within the green channel. Since the beginning of this year, we see that the market has been moving from the upper green line toward the lower green line.

SimpleFX NIKKEI225 Chart Analysis: May 20, 2022
The price touched the lower green wall in the first half of March. After that, we saw a steep upward movement within the yellow channel. In a short period of time, the price reached the upper yellow wall.
The bulls were unable to break through the upper resistance lines of the two channels, so the stock price went down. There is a high probability that in the near future the bears will re-approach the lower support line of the yellow channel. If the level of 25985 breaks, the stock may collapse to the next support level, which is located on the lower green line, that is, 23411.
Alternatively, it is assumed that after the last pullback from the lower yellow wall, the market turned around and an upward movement began in the direction of the upper green line. If the bulls can reach the resistance level of 27511 and then break through it, then the way will open for them to further grow to the upper yellow line and the resistance level of 30085.


