


Judging by the internal structure of the USDTRY currency pair, it can be seen that the market is directed in an upward direction, forming a bullish trend that moves within a large green channel.
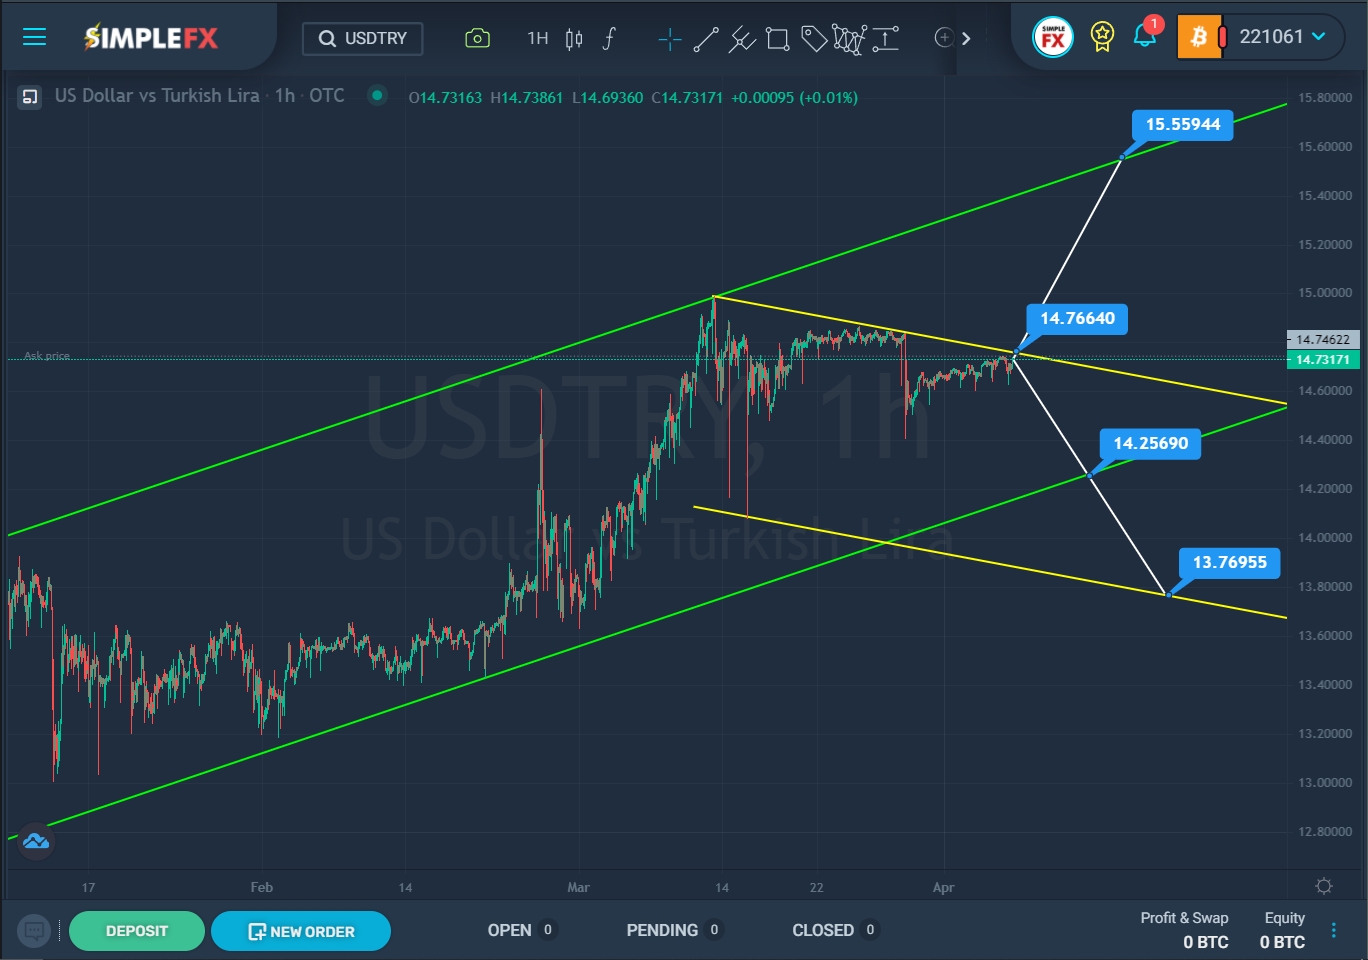

Throughout February, the price moved next to the lower green wall. The bulls reached the lower green wall by the end of February and then pushed off from it. In March, there was a rapid growth in the direction of the upper green line. However, in the middle of last month, when the price touched the upper green line, the bulls could no longer hold their positions, so the market began to move in the opposite direction. The last section of the chart describes a descending channel of yellow color.
Currently, the price is in the upper yellow area. We see that the bulls, after a short respite, may have the opportunity to break through the upper yellow line near the resistance level of 14.766. If the yellow line is broken, the currency pair will start to grow again in the direction of the upper green line and the resistance level of 15.559.
Alternatively, it is assumed that the price will push off from the upper yellow wall and start moving in a downward direction to the lower green line and the support level of 14.256. With a successful breakdown, the pair may depreciate to the level of 13.769, which is located on the yellow support line.


