


Today we will consider the situation for one of the main cryptocurrencies – BTCUSD. The current structure of Bitcoin suggests the formation of an uptrend that moves inside a large green channel.

Since the second half of February, there has been a decrease in the value of quotations to the lower green line. By the end of February, the price touched the lower green wall, but the bears could not break through it, so the market turned around and began to move in an upward direction. This section of the chart describes an ascending channel of yellow color.
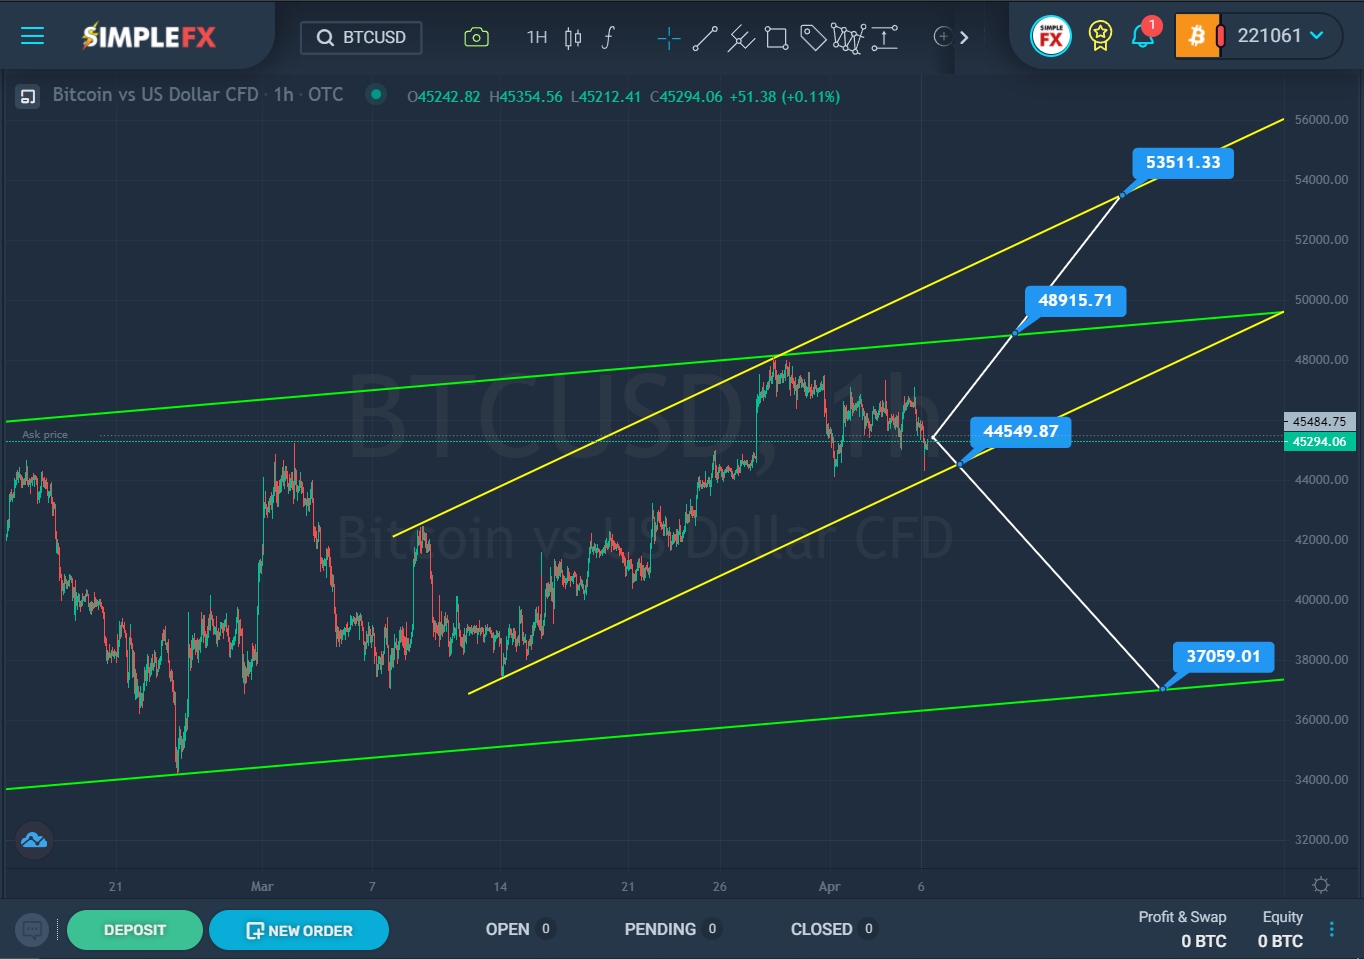
In the last section of the chart, we see that the price has reached the upper yellow line at the intersection with the upper green line. Then there was a rebound, and the price began to decline in the direction of the lower yellow line. Perhaps the bears are targeting the support level of 44549.87, which is located on the lower yellow wall. In case of a successful breakdown, market participants can expect a more powerful and prolonged drop in the direction of the lower green line and the support level of 37059.01.
If the lower yellow line is not broken, then the price will push off from the support line and begin to rise in the direction of the upper green wall and the resistance level of 48915.71. With a successful breakdown of this price level, bulls can bring the market to a higher resistance level of 53511.33, which is located on the upper yellow wall.


