


The formation of the GBPAUD pair suggests the construction of a significant bearish trend, which is rapidly moving down within the green channel. Since mid-February, the price has moved from the upper green line toward the lower green line. The last section of the chart describes a small descending channel of yellow color.
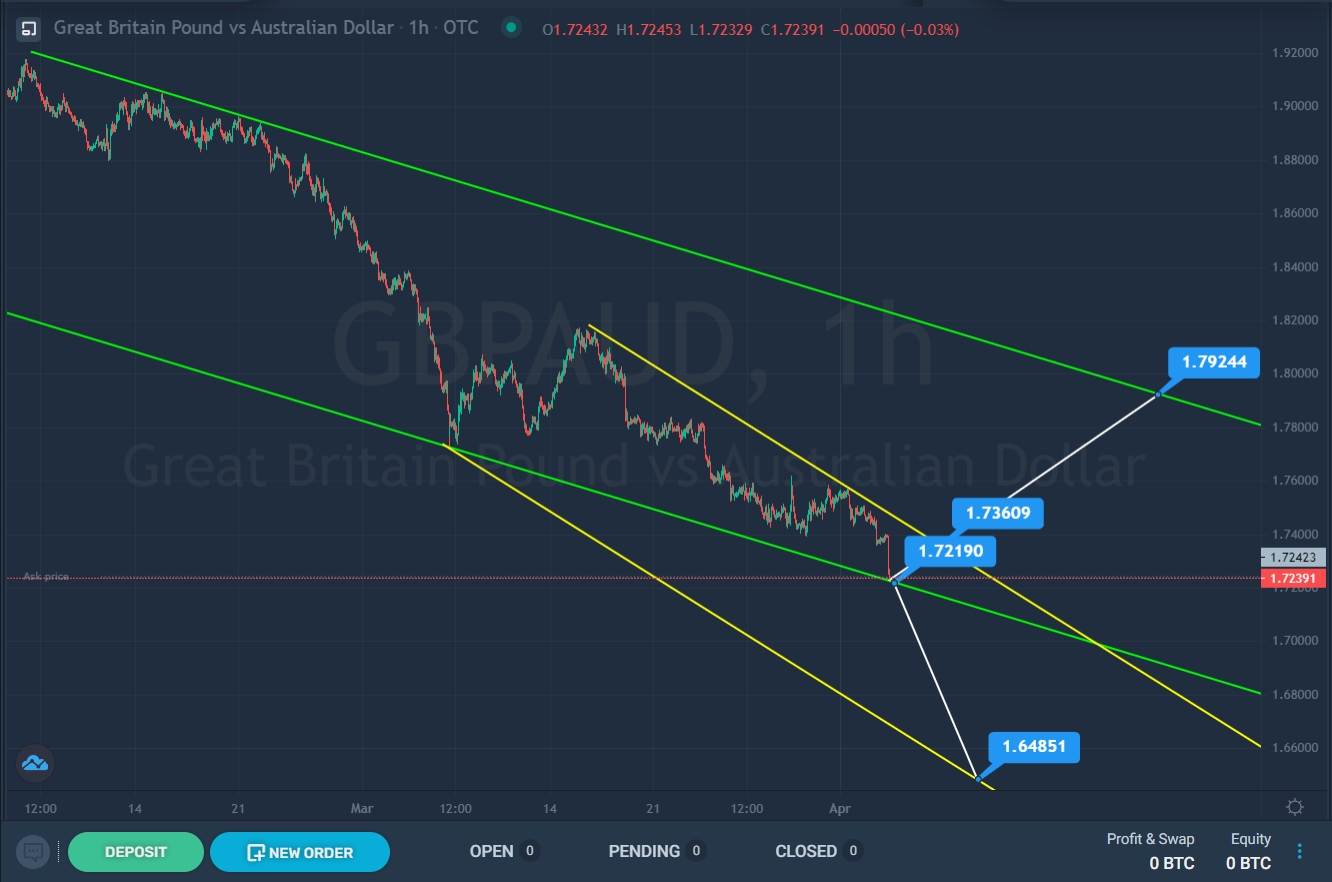

Not so long ago, the price pushed off the upper yellow wall, and now we are in the lower green area. In the current situation, there are two possible scenarios.
The first option assumes a continuation of the fall in value. However, the bears will have to break through the support level of 1.721. Only if this level is broken the price can continue to decline to the lower yellow line and the support level of 1.648
In the second option, it is assumed that the price may turn around, and the bulls will have a chance to take over the market. In this case, the price is expected to move to the upper yellow line and the resistance level of 1.736. If this level is broken, the price may continue to move up to the upper green line and the resistance level of 1.792.
An approximate scheme of possible future movement is shown on the chart.
With an upward price movement, it is possible to consider opening deals for purchases. With the continuation of the depreciation of the currency pair, it is recommended to continue to open short positions.


