


For Ethereum, we see the development of a global trend that is moving in an upward direction within a large green channel.
Since the second half of February, the price has been moving in a downward direction. After the price touched the lower green support line, the bulls entered the market again. The last section of the chart describes an ascending channel of yellow color.
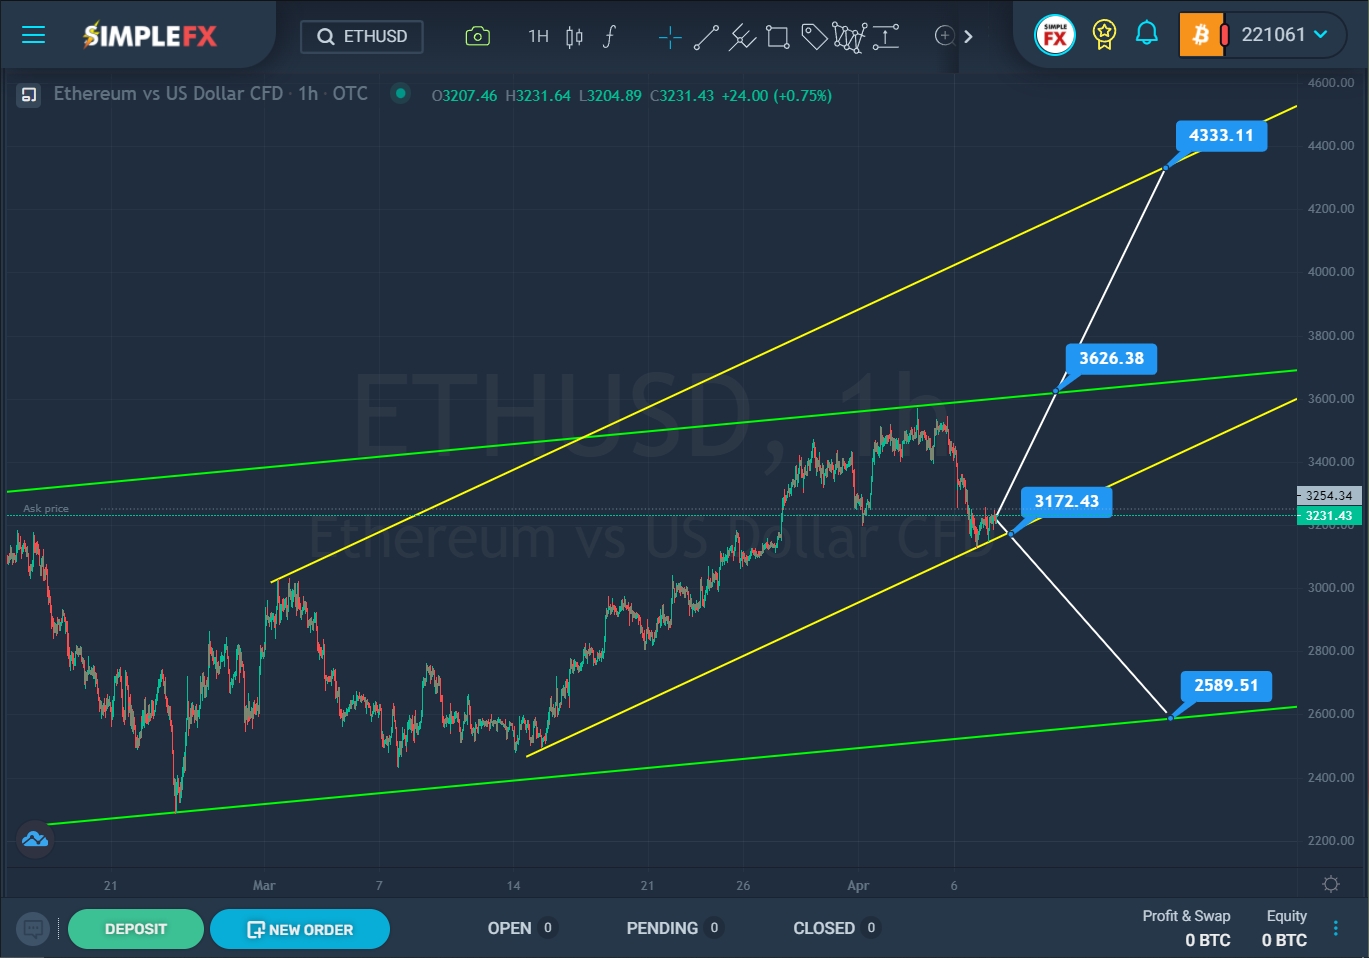

Currently, the price is in the upper green area. Not so long ago, the bulls already tried to break through the green line, but they did not have enough strength. In a short period of time, the market has reached the lower yellow wall, but so far the support line is holding back the market and does not allow the bears to go further. In the current situation, there are two possible scenarios. Perhaps, after the last bounce from the yellow wall, the price will go up to the upper green line, and if the bulls can break through the resistance level of 3626.38, then a path will open for them to the upper yellow line and the resistance level of 4333.11.
In the second option, market participants may expect a breakdown of the lower yellow line near the support level of 3172.43. In this case, the pair will continue to depreciate. The next important support level is 2589.51, which is located on the lower line of the green channel.


