


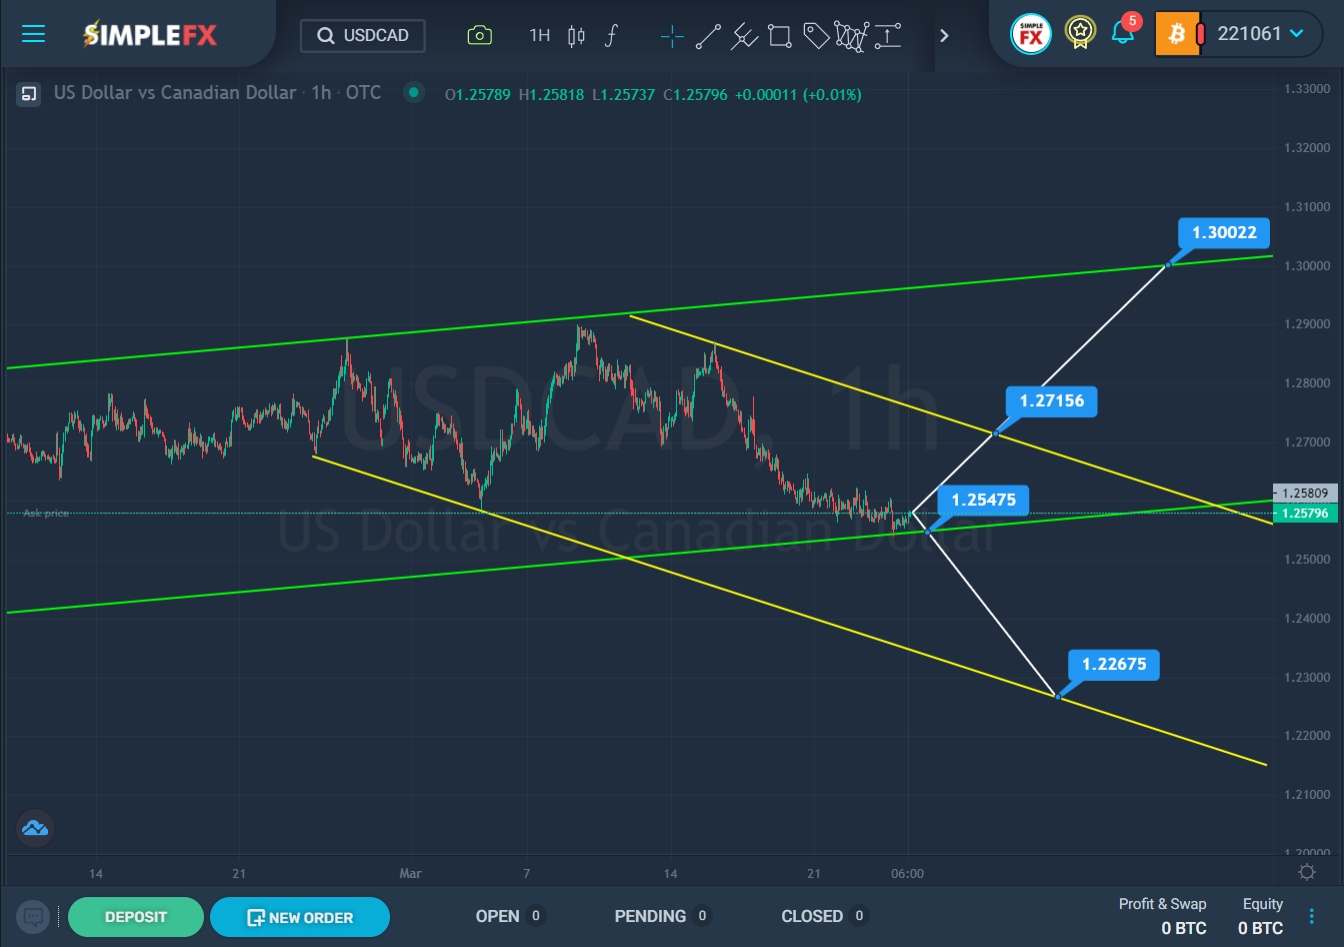
The current formation of the USDCAD currency pair indicates that an uptrend is forming, which moves inside the green channel. However, the last section of the chart, where we see a downward price movement, hints at a downward trend that will move inside the yellow channel.

SimpleFX USDCAD Chart Analysis: March 24, 2022.
In the near future, the bearish direction of the price to the lower green line is assumed. With a greater pressure of bears, there is a risk of a breakdown of the support level of 1.255. If the lower green wall is broken, then the downward trend will continue to develop in the direction of the lower yellow line and the support level of 1.226.
Alternatively, it is assumed that the price, starting from the lower green line, will begin to gain momentum and will move up. The upward trend will continue until the resistance level of 1.271, which is located on the upper yellow line, is reached. If the bulls are able to break through the specified level, then a path will open for them to the upper green wall and the resistance level of 1.300.
When confirming the bull market, it is recommended to consider opening deals for purchases. If the second option is confirmed on the market, then it is recommended to consider opening sales transactions.
An approximate scheme of possible future movement is shown on the chart.


