


The current structure of the NDX100 stock index suggests the formation of a global downtrend that moves inside a large green channel.

SimpleFX NDX100 Chart Analysis: March 25, 2022.
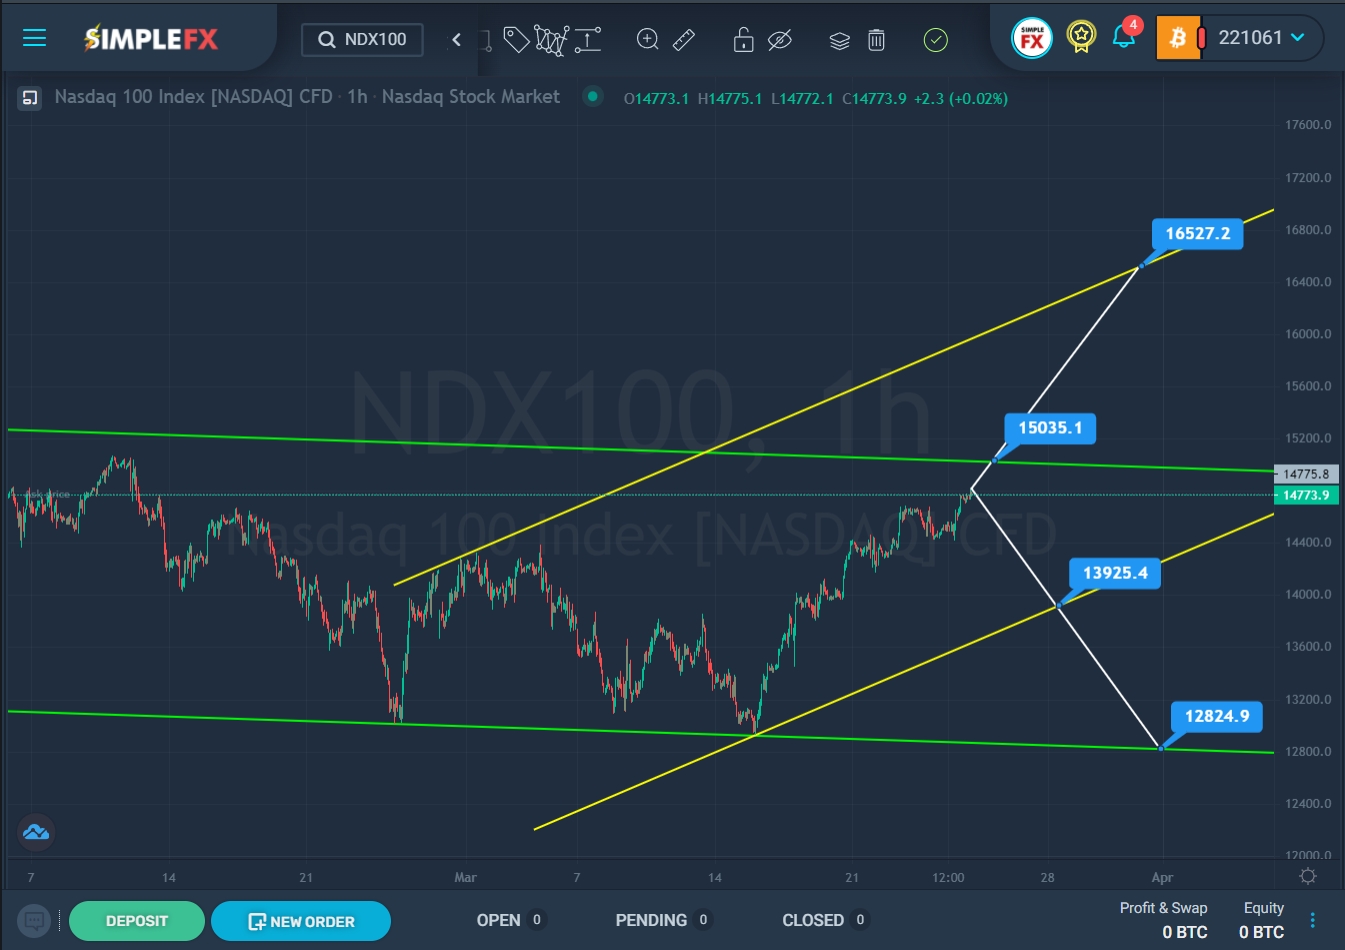
As shown on the chart, there is a high probability that the market will form an upward trend inside the bullish yellow channel in the near future. To confirm this forecast, it is necessary that the bulls break through the upper green wall. Currently, the market is in the upper green area, so the bulls have every chance to bring the market to the resistance level of 15035.1, and then break through it. If the specified level is broken, the uptrend will be confirmed, and the growth of quotations will continue to the upper yellow wall and the resistance level of 16527.2, which is located on it.
Alternatively, it is assumed that the bulls will not be able to break through the upper green line, or the price will not touch it at all. Then the index may begin to decline in the direction of the lower yellow wall and the support level of 13925.4. If this price level breaks, the NDX100 index may fall to the next support level of 12824.9, which is located on the lower wall of the green channel.
With a downward price movement, it is worth considering opening sales deals. When confirming a bullish movement, it is recommended to consider opening deals for purchases.


