


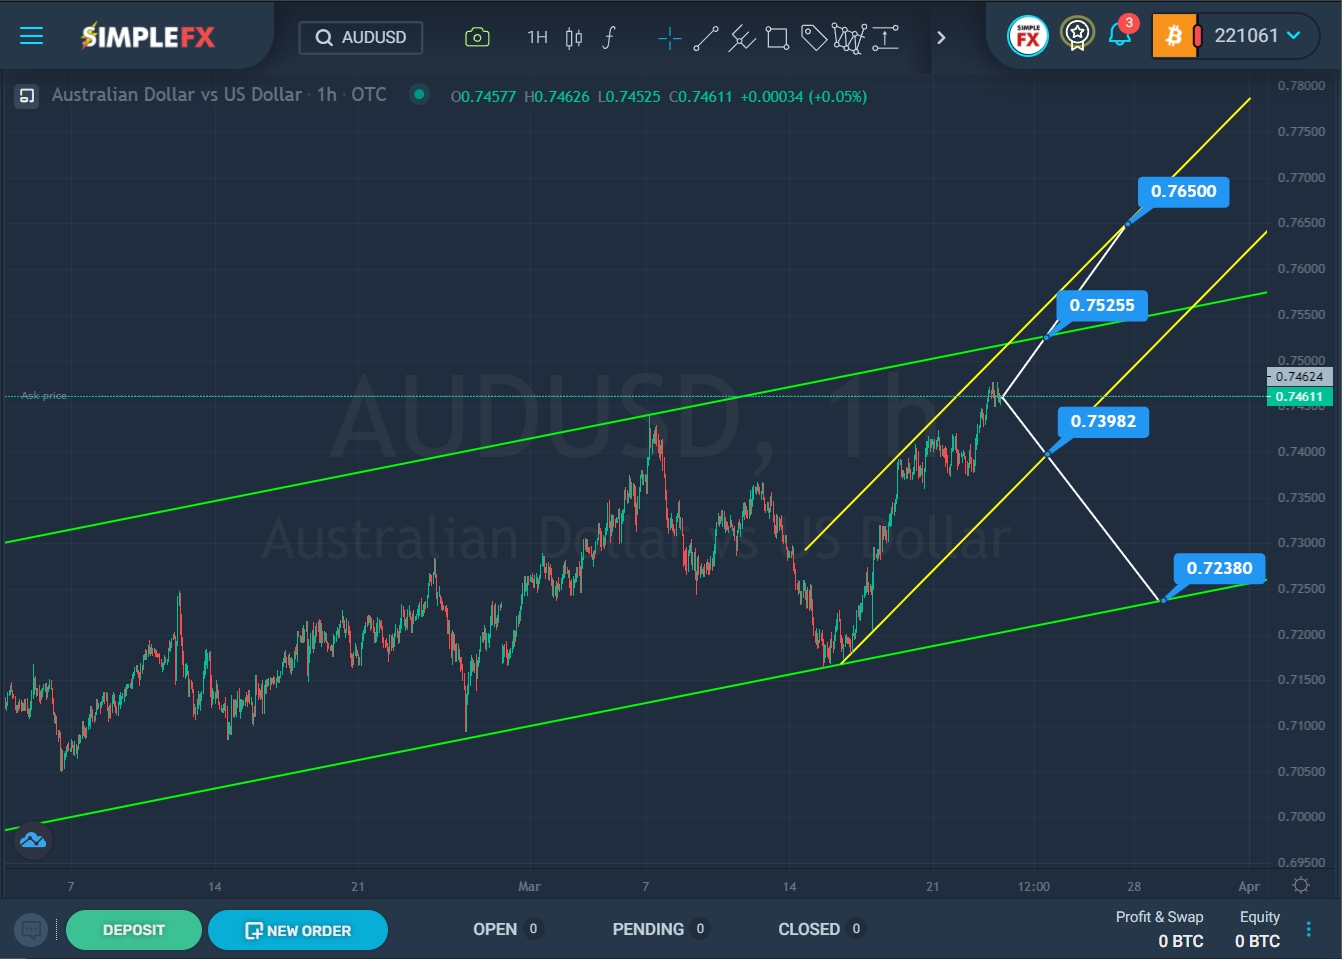
On the current chart for the AUDUSD currency pair, we see the development of a global upward trend within a large green channel.

SimpleFX AUDUSD Chart Analysis: March 23, 2022.
We see that at the beginning of March, the price reached the upper green line. However, the bulls did not have enough strength to continue growing, and we saw a drop in value. Not so long ago, the price touched the lower green line, after which it pushed off from it, and then the upward movement began again. This suggests that a correction has been formed and the market is ready to move up further.
The last section of the chart describes an ascending channel of yellow color. Currently, the market is located near the upper yellow line. There is a possibility that the price will continue to rise and soon the bulls may break through the resistance level of 0.752. At the breakdown of this level, the currency pair’s exchange rate may continue to move to the resistance level of 0.765, which is located on the upper yellow line.
Alternatively, a downward price movement is assumed. The first target for bears is at the lower yellow line- the support level of 0.739. At the breakdown of this price level, the price of quotations is expected to continue falling to the lower green line and the support level of 0.723.
An approximate scheme of possible future movement is shown on the chart.


