


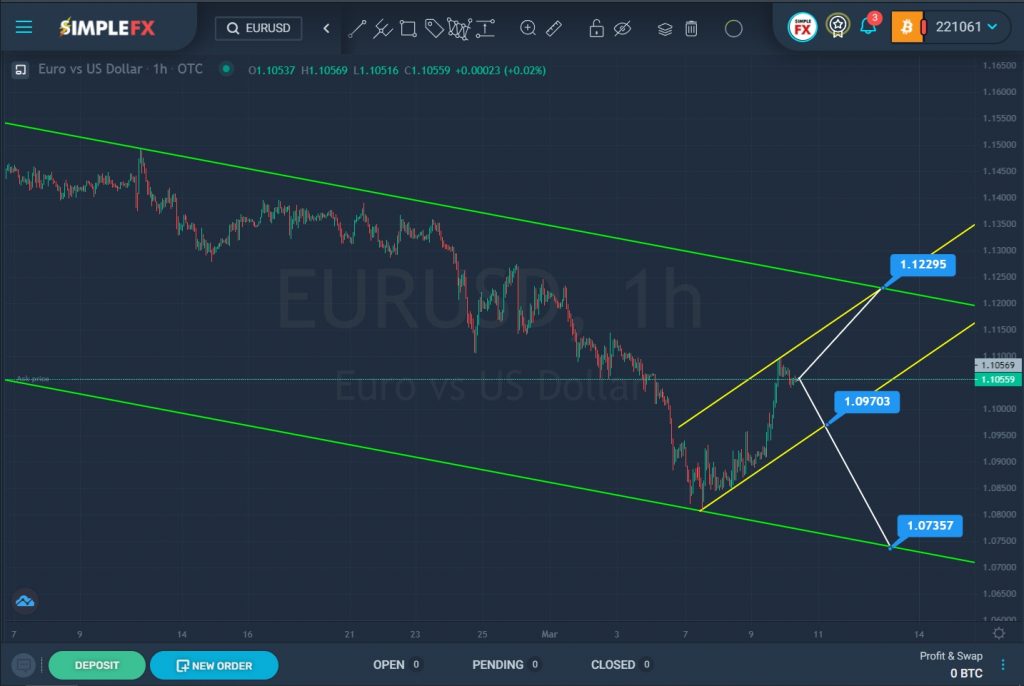
For the EURUSD currency pair, we see the construction of a large downtrend that moves inside the green channel.

SimpleFX EURUSD Chart Analysis: March 10, 2022.
We see the market movement from the first half of February to today on the current chart. The bulls reached the upper green line in early February, but could not break through it. Thus, the market pushed off from this line and began to move in a downward direction. A few days ago, the price touched the lower green wall, after which we saw a rebound and a sharp increase. The last section of the chart describes a yellow channel.
Not so long ago, the price pushed off from the upper resistance line of the yellow channel. It is possible that the bulls will continue to push the price up. In this case, the currency pair may continue to grow in the direction of the upper green line and the resistance level of 1.1229. Also at that level, the upper lines of the yellow and green channels intersect.
Alternatively, the market is expected to move down inside the yellow channel to the lower green line and the support level of 1.0735. However, first, the bears need to break through the support level of 1.0970, which is located on the lower wall of the yellow channel.
With a bullish market movement, it is possible to consider opening deals for purchases. When confirming a bearish movement, we can consider opening short positions.


