


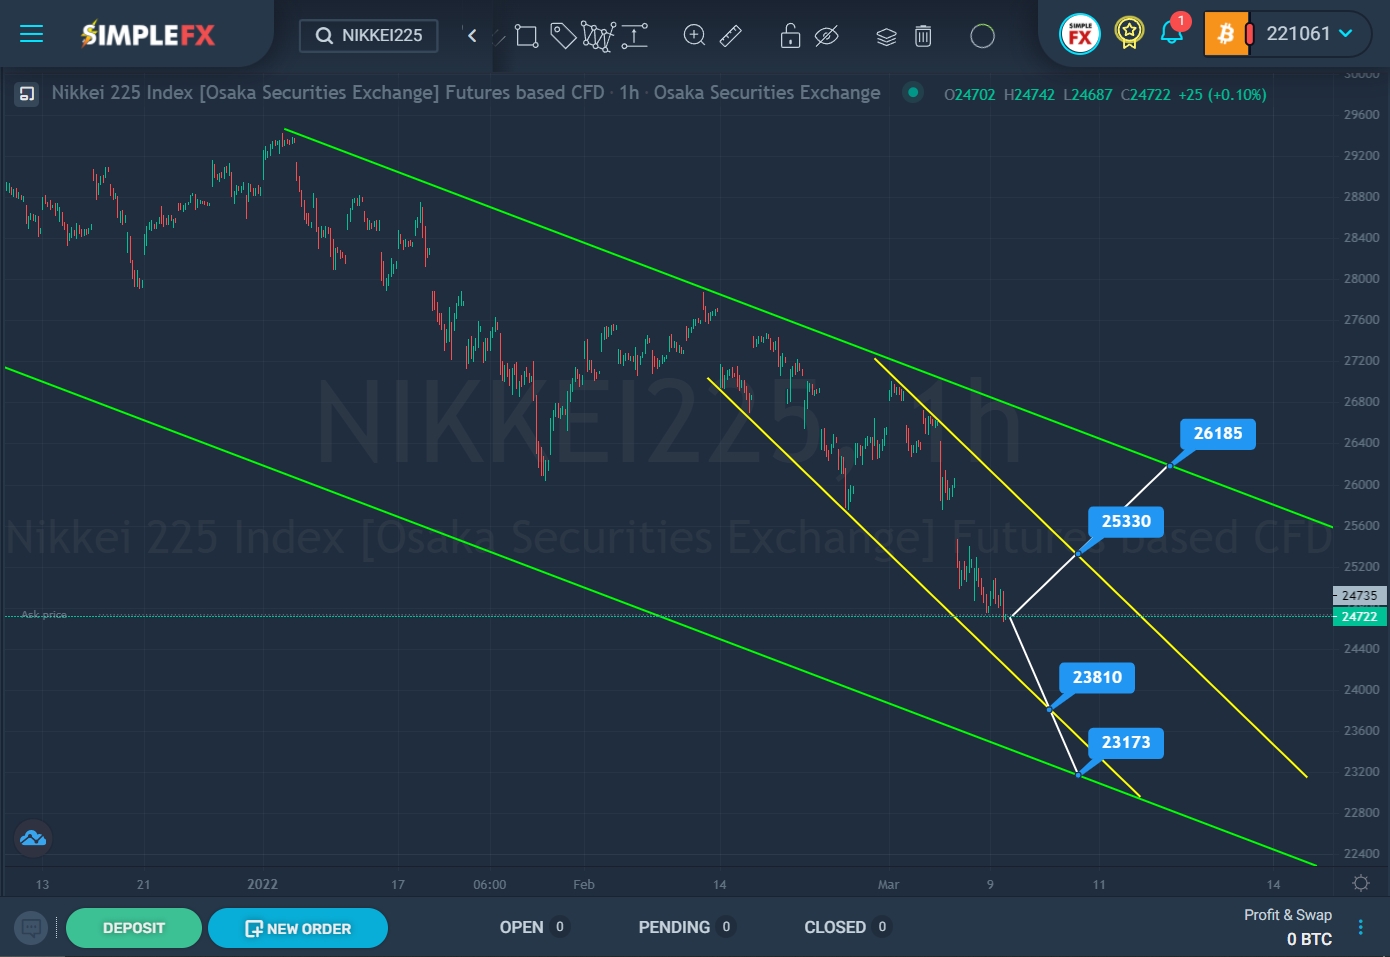
The current formation of NIKKEI225 shares suggests the development of a downtrend that moves within the green channel. We see that since the beginning of this year, the market has been forming a zigzag pattern in the direction of the lower green line. The last section of the price movement describes a small yellow channel.

SimpleFX NIKKEI225 Chart Analysis: March 9, 2022
Recently, the price touched the upper yellow wall. Then we saw a rapid downward movement of the market. It can be assumed that bears have enough strength to lead the market. In this case, the price will continue to fall in the next coming trading weeks. The bears’ first target is the support level of 23810. With a successful breakdown of this level, a path will open to the lower green line and the support level of 23173.
Alternatively, we can expect a market reversal and the beginning of an upward movement in the direction of the upper yellow line. If the bulls can reach the resistance level of 25330 and then break through it, then the way will open for them to further grow to the upper green line and the resistance level of 26185.
When the market is bullish, it is worth considering opening deals for purchases. If the price continues to fall, then we can continue to open sales deals.


