


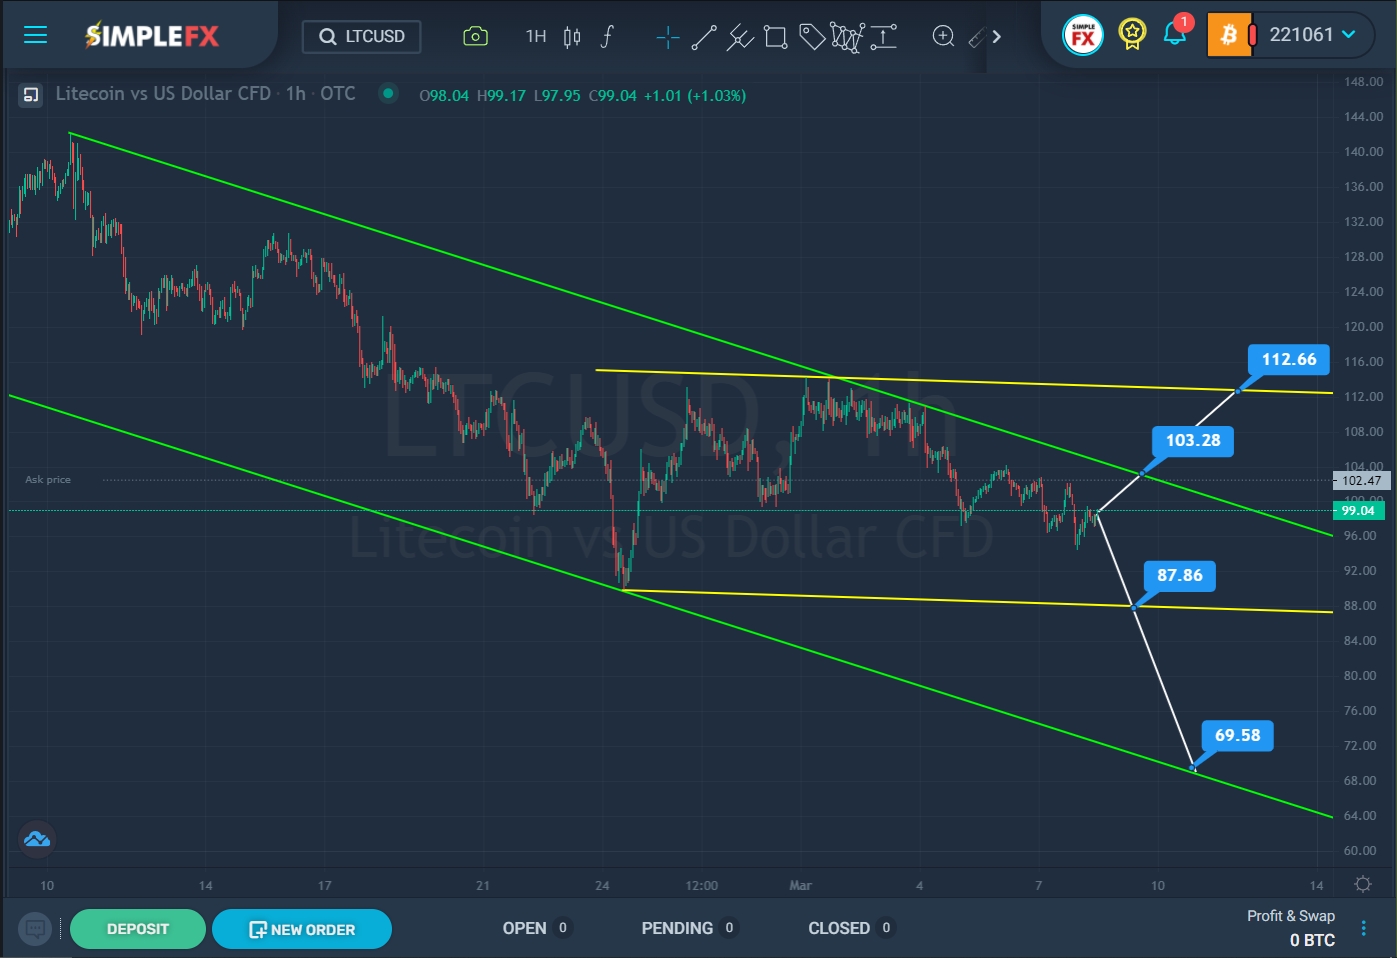
For the LTCUSD cryptocurrency pair, we see the formation of a global downtrend that moves within the green channel.

SimpleFX LTCUSD Chart Analysis: March 8, 2022.
On the current chart, we see that since the first half of February, the market has been moving from the upper green line in the direction of the lower green line for two weeks. After February 24, the price touched the lower green wall, but the bears failed to break through it. Since then, the market has been moving flat within the horizontal yellow channel.
It is possible that the market will continue its upward movement and will soon reach the resistance level of 100.28, located on the upper green line. With a successful breakdown of this level, the cryptocurrency pair may rise to the next resistance level of 112.66, which is located on the upper yellow line.
Alternatively, a downward movement of the cryptocurrency pair is expected. Initially, the price may fall to the support level of 87.86, which is located on the lower green line. If this level breaks, the sideways movement is likely to be stopped and a downtrend will begin, which will move towards the next important level 69.58, located on the lower wall of the green channel.
An approximate scheme of possible future movement is shown on the chart.


