


Apparently, for the GBPUSD currency pair, we see a downward movement of the market within a large green channel.
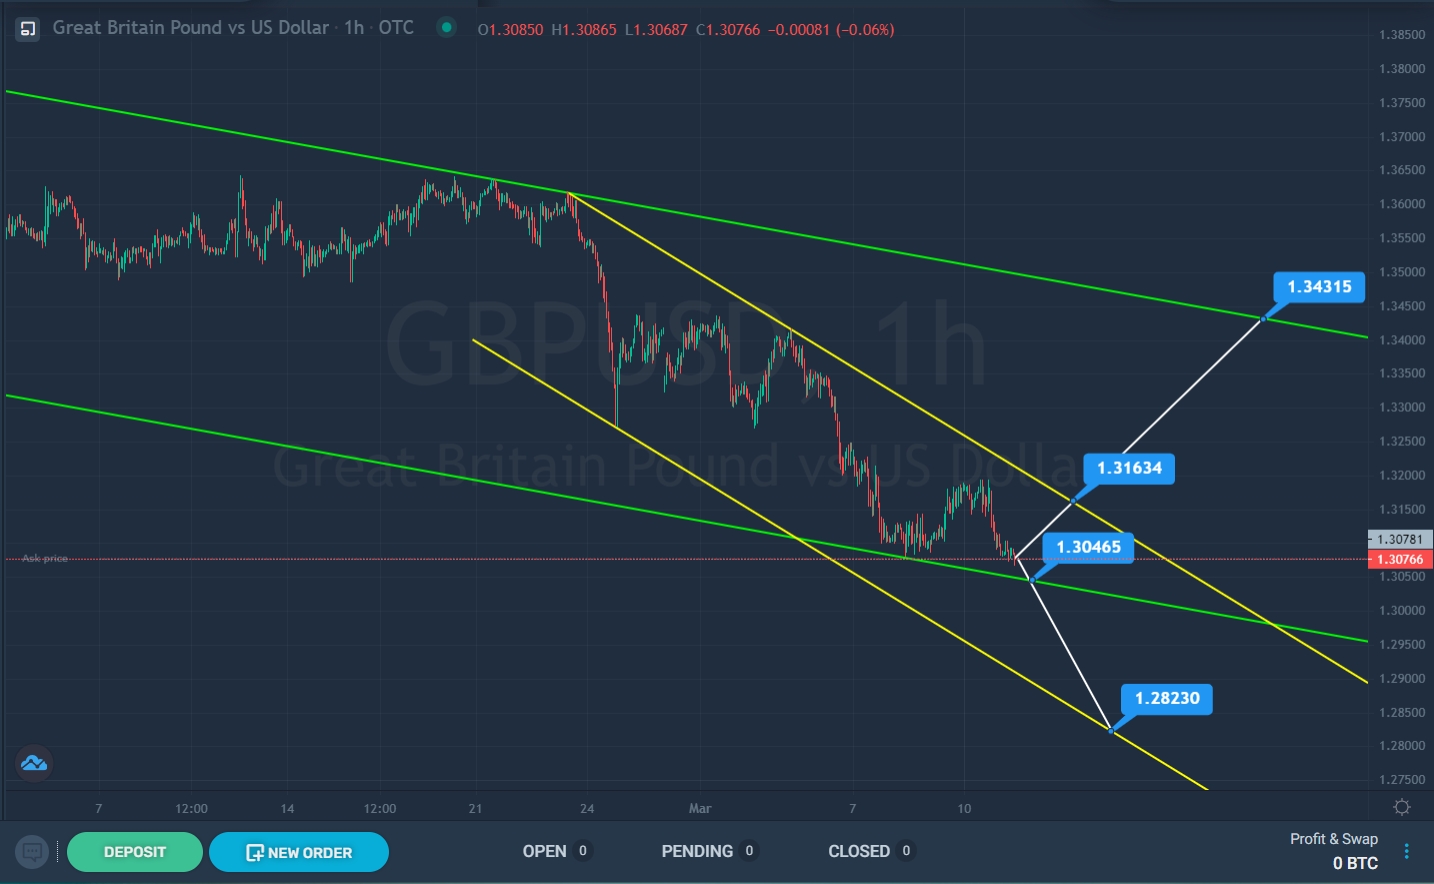

SimpleFX GBPUSD Chart Analysis: March 11, 2022.
In the second half of February, the price reached the upper green line. We see that the bulls made several attempts to break through the resistance line, but they failed. After the third attempt, the price pushed off from the upper green wall and began to move down within the yellow channel.
Currently, the market is near the lower green line. We see that a few days ago the bears tried to break through the support line, but without success. Perhaps, with a repeated decline to the lower green line, the bears will still be able to break through the support line near the price level of 1.304. If the specified level breaks, the price may continue to fall to the lower line of the yellow channel and the support level of 1.282.
Alternatively, an upward movement of the currency pair is expected in the direction of the upper yellow wall and the resistance level of 1.316. If the bulls can break through this level, then they will have access to the next resistance level of 1.343, which is located on the upper line of the green channel.
An approximate scheme of possible future movement is shown on the chart.


