


Most likely, for the USDTRY currency pair, the market is directed in an upward direction, forming a bullish trend that moves within a large green channel.

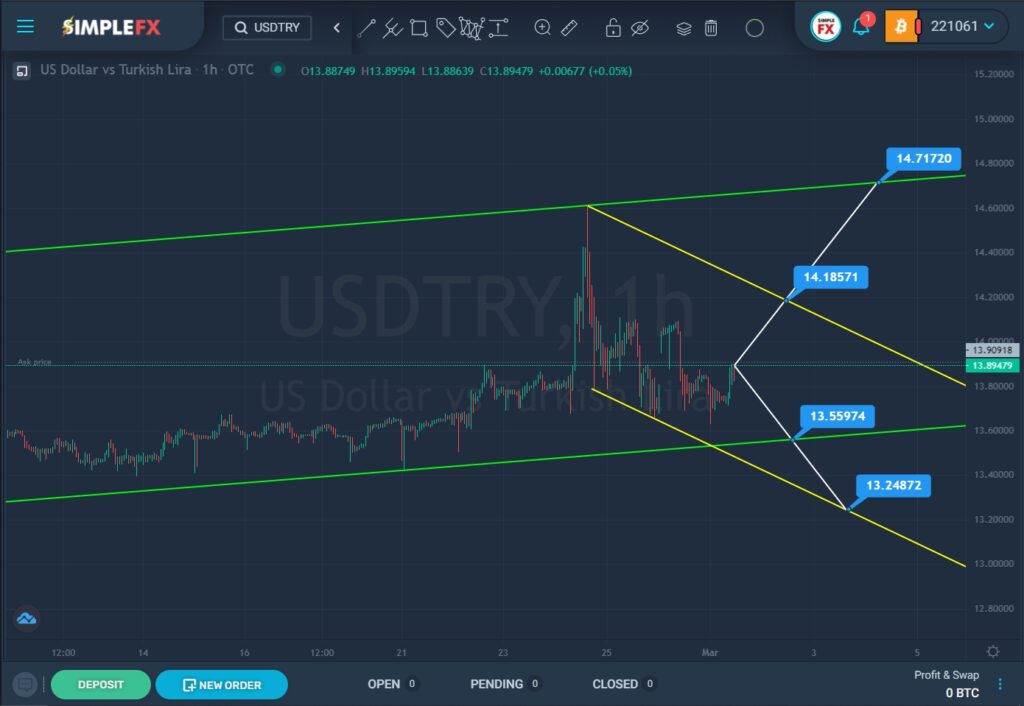
Over the past month, the price has gone from the lower green line to the upper green line. The bulls reached the upper green wall by the end of February and then pushed off from it. The last section of the chart describes a yellow descending channel.
Currently, the price is in the lower yellow area. There is a chance that the bears will be able to push the market to the lower green wall and the support level of 13.559. With a successful breakdown, they will have a clear path to the lower yellow line and a support level of 13.248.
However, according to the latest price movement, it can be assumed that the market will continue to move up. In this view, a bullish movement is expected in the direction of the upper yellow wall to the resistance level of 14.185. If this price level breaks, the way will open for bulls to the upper green line and the resistance level of 14.717.
When confirming the first option, it is recommended to consider opening short positions, and when confirming a bullish trend, it is worth thinking about opening long positions. Perhaps we will continue to observe the pair in the future.


