


It is still an open question how BTC will react to the biggest geopolitical crisis since the cold war. At first, cryptocurrencies collapsed along with stocks, but now it is recovering. How will it establish itself in the long run? Let’s take a look at the technical analysis of the current trend.
Judging by the structure, the BTCUSD cryptocurrency is forming a downtrend that moves inside a large green channel.

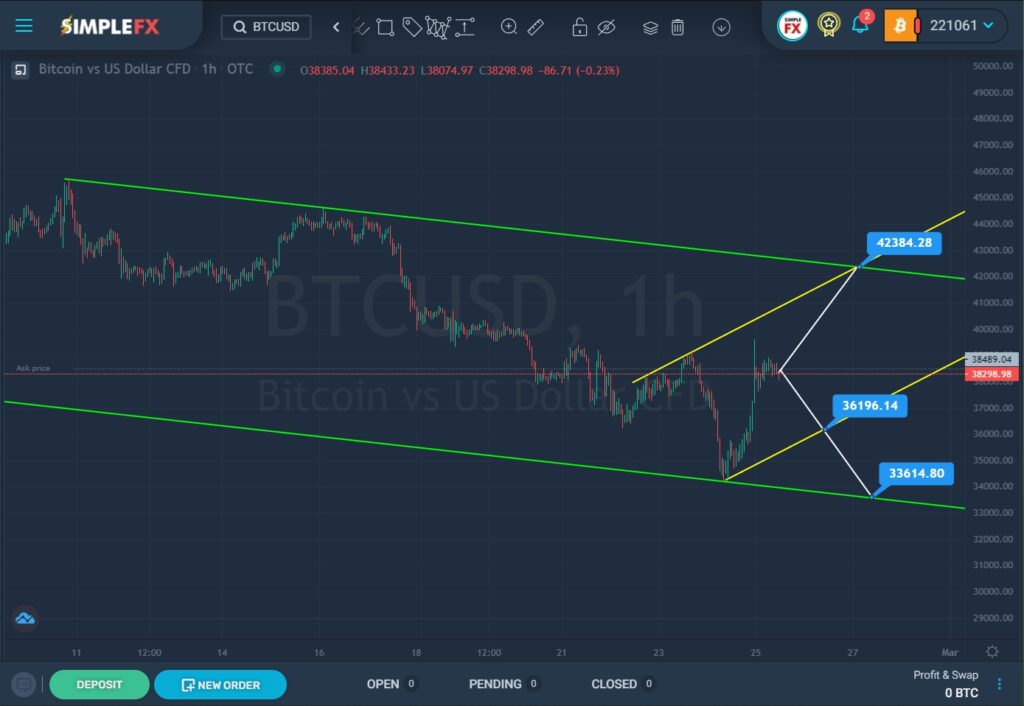
In the first half of February, the price moved in the upper green area, and then, after the 15th, the price of quotations began to decrease to the lower green line. Not so long ago, the price touched the lower green wall, but the bears could not break through it. The last section of the chart describes a small ascending channel of yellow color.
In the last section of the chart, we see that the price has reached the lower yellow line at the intersection with the lower green line. Then there was a rebound, and the price sharply went up in the direction of the upper yellow line. Most likely, the bulls are targeting the resistance level of 42384.28, which is on the upper lines of the yellow and green channels.
Alternatively, it is assumed that the bulls will fail, then a price reversal is expected and the beginning of a second decline to the lower yellow line. If the bears can break through the support level of 36196.14, then they will open the way to the lower wall of the green channel and the support level of 33614.80. An approximate scheme of possible future movement is shown on the chart.
With an upward price movement, it is worth considering opening deals for purchases. When confirming a bear market, it is recommended to consider sales.


