


For the NEOUSD cryptocurrency pair, we observe an upward movement of the market and the formation of a bullish trend that moves within a large green channel. The last leg, which began to be built after the rebound from the lower green wall in the second half of February, describes the ascending channel of yellow color.

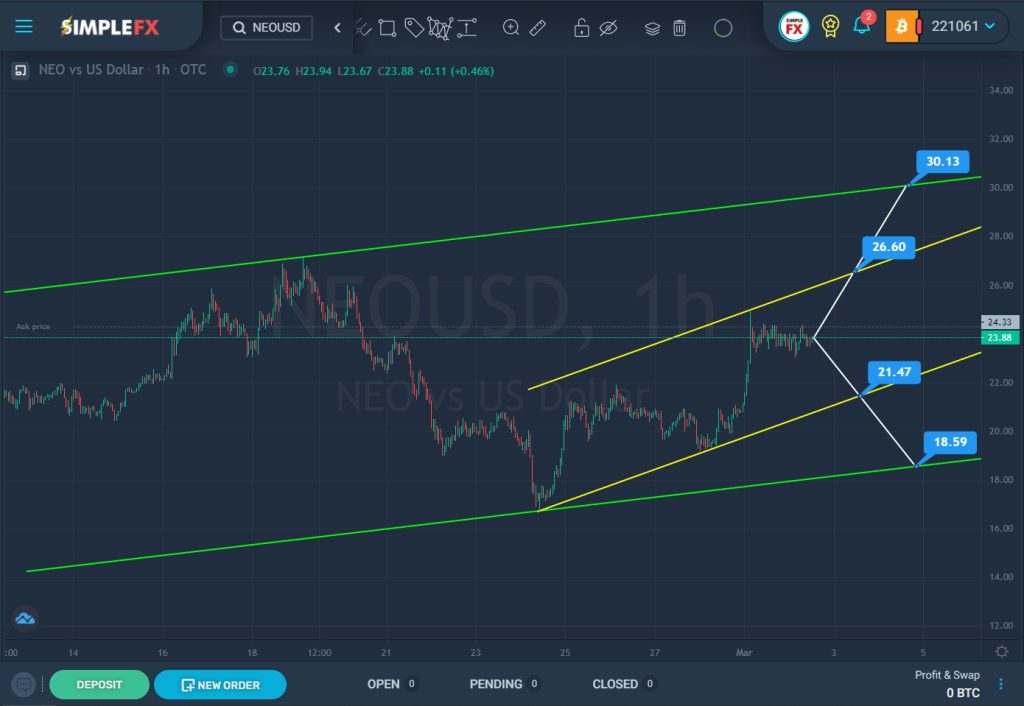
SimpleFX NEOUSD Chart Analysis: March 2, 2022.
In the next coming trading days, we can expect the price to fall to the yellow line and the support level of 21.47, which is located on it. If the specified level is broken, the cryptocurrency pair may fall to the support level of 18.59, which is located on the lower green wall.
Alternatively, an upward movement of the market is expected. On the way to the bulls, we see a resistance level of 26.60. With a successful breakdown of this level, there will be no obstacles to the continuation of bullish growth in the direction of the next resistance level of 30.13, which is located on the upper line of the green channel.
If the bearish movement of the market is confirmed, it is worth considering opening sales deals. If the market chooses the second scenario, and the cryptocurrency pair goes up, then it is recommended to consider opening deals for purchases.
An approximate scheme of possible future movement is shown on the graph. We will continue to observe the cryptocurrency pair further.


