


For the EURUSD currency pair, we see the construction of a large downtrend that moves inside the green channel.
On the current chart, we see the market movement from December to today. Since the beginning of December, the price has been gradually increasing from the lower green area to the upper green wall. The bulls reached the upper green line in the second half of January, but could not break through it. Thus, the market pushed off from this line and began to move in a downward direction within the yellow descending channel.

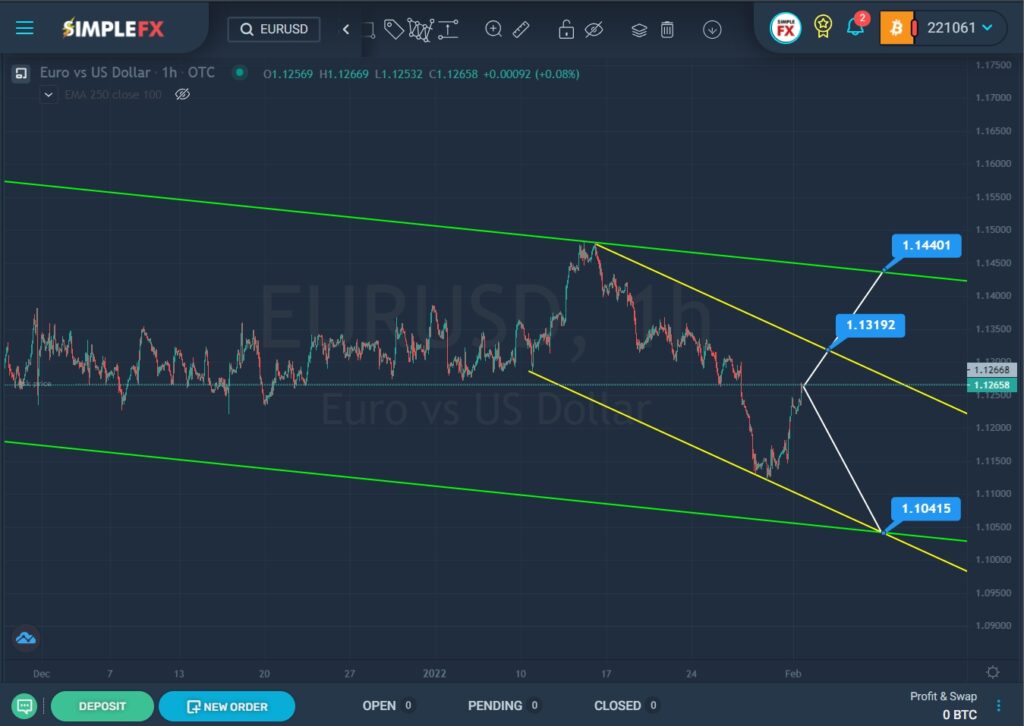
Not so long ago, the price pushed off from the lower support line of the yellow channel and began to grow sharply. If the bulls can break through the upper yellow line near the resistance level of 1.131, then market participants will be able to observe the continuation of the appreciation to the upper green line and the resistance level of 1.144.
Alternatively, the downward movement of the market inside the yellow channel is expected to continue to the lower green line and the support level of 1.104. At the specified price level, the lower walls of the two channels have an intersection point.
With a bullish market movement, it is possible to consider opening deals for purchases. When confirming a bearish movement, it is possible to consider opening short positions.


