


The formation of NIKKEI225 shares suggests the development of a downtrend that moves within the green channel. We see that since the second half of September, the market has been forming a zigzag pattern in the direction of the lower green line. The last section of the price movement describes a small yellow channel.

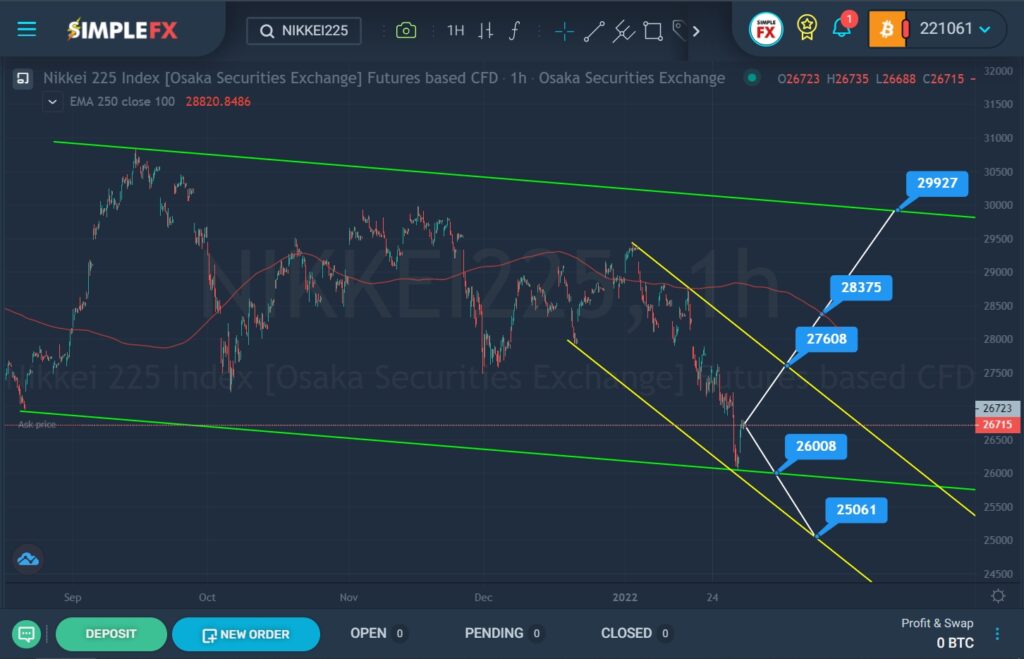
Recently, the price touched the lower green wall. It can be assumed that the bears have weakened and the bulls are ready to enter the market. In this case, the price will start to rise in the next coming trading weeks. The first target where the bulls are oriented is the resistance level of 27608.
With a successful breakdown of this level, a path will open to the upper green line and the resistance level of 29927. However, on the way of the bulls, we see an average moving line, at the breakdown of which the bullish trend will be confirmed.
Alternatively, we can expect a repeated fall to the lower green wall and the support level of 26008. If this level breaks, the price may fall to the lower yellow line and the support level of 25061.
When the market is bullish, it is worth considering opening deals for purchases. If the price continues to fall, then we can continue to open sales deals.
An approximate scheme of possible future movement is shown in the chart.


