


The 1H timeframe of the AUDUSD currency pair shows the construction of a bullish trend that moves within a large green channel.

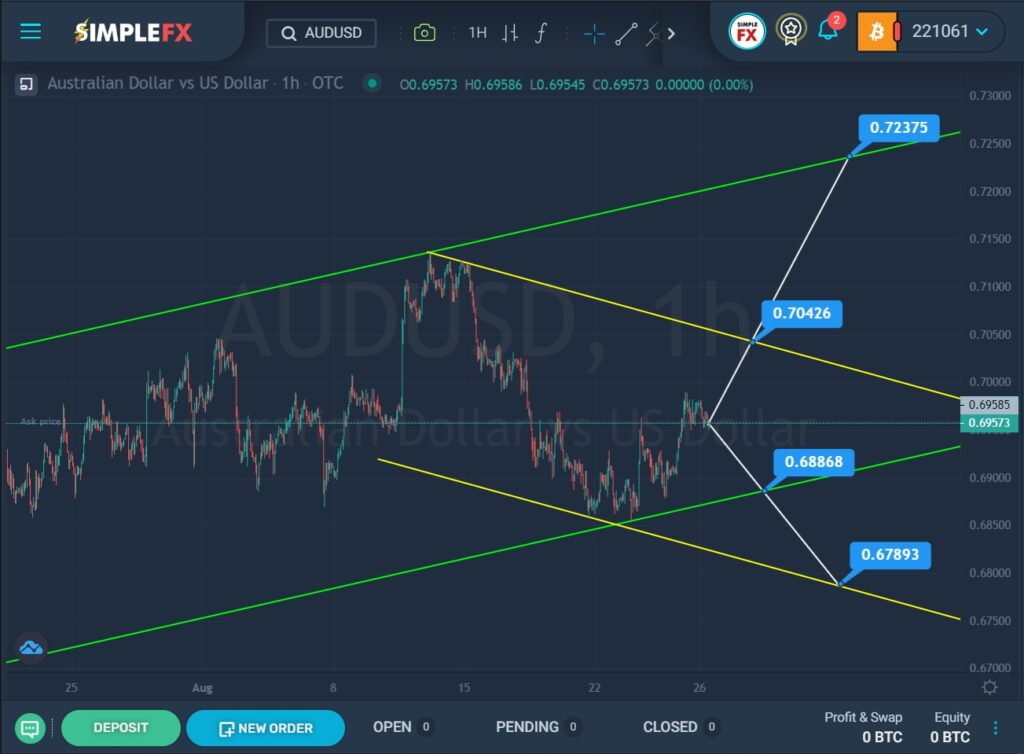
We see that by mid-August, the price reached the upper green line. However, the bulls did not have enough strength to continue growing, and we saw a rapid drop in value within the yellow channel. Recently, the price touched the lower yellow wall. Then the market began to grow in the direction of the upper yellow line.
Currently, the market is near the center of the yellow channel. The bullish trend is expected to continue. The first target for bulls is at the upper yellow line– the resistance level of 0.704. If this price level is broken through, we could expect a continuation of the growth in the value of quotations to the upper green line. The second target for the bulls is the resistance level of 0.723.
Alternatively, there is a possibility of the market falling to the lower green line. The breakdown of the 0.688 level, which is located on the lower green line, will serve as confirmation that the trend will continue to move down to the next support level of 0.678, which is located on the lower yellow wall.
An approximate scheme of possible future movement is shown on the chart.


