


It is assumed that the GBPJPY pair continues to form a bearish trend, which moves inside the green channel. The current chart shows the market movement since mid-July of this year.

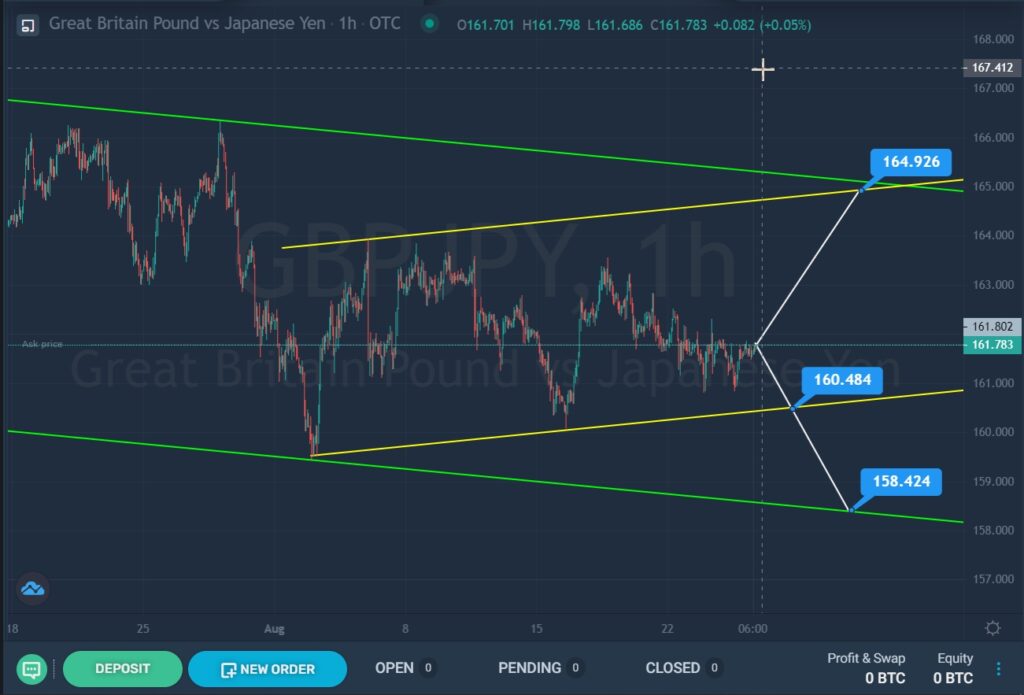
By the end of July, the price rose to the upper green line, then it pushed off from it and began to fall to the lower green wall. In early August, the market reached the lower green wall, but the bears failed to break through it, so the price began to move in the opposite direction. This period describes a bullish yellow channel.
Currently, the market is located in the lower yellow area and in the center of the green channel. It is assumed that soon the price will reach the yellow line. If the bears can break through the support level of 160.48, then the pair will continue its fall to the next support level of 158.42, which is located on the lower green wall.
Alternatively, it is assumed that bulls will try to take over the market, that is, currency growth is possible. It is possible that the bulls have set a target of 164.92. The indicated price level is located on two resistance lines of the yellow and green channels.
An approximate scheme of possible future price movement is shown by trend lines.


