


The American SPX500 index seems to be forming a large bullish trend in the long term, which is moving inside the green channel.

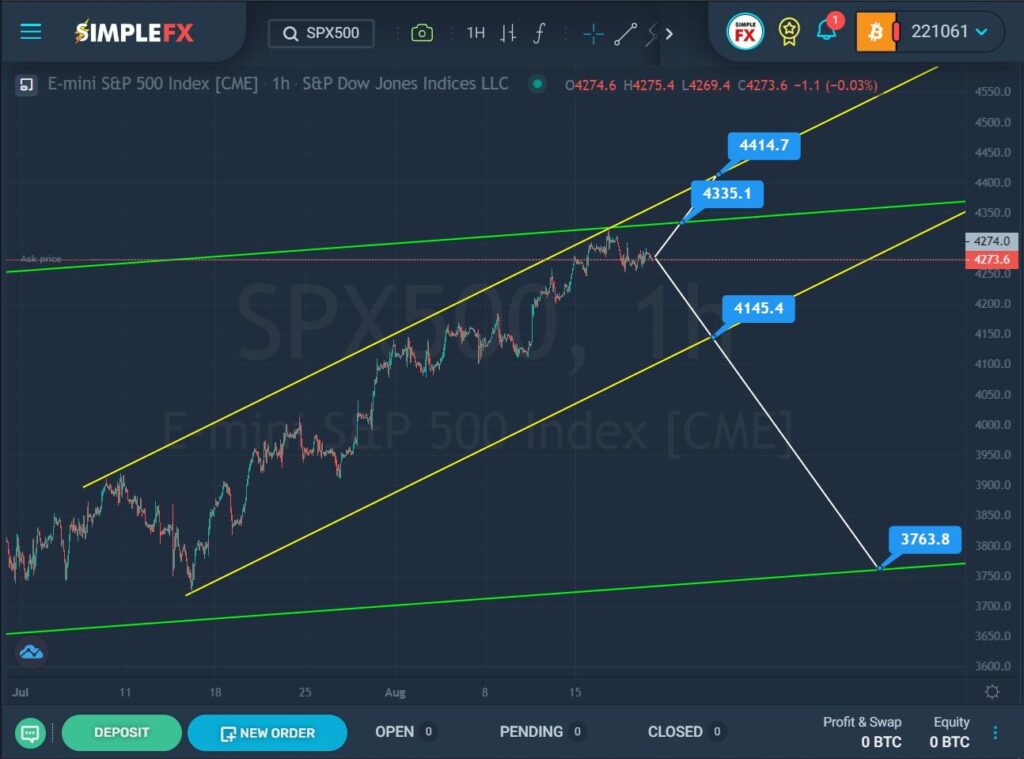
On the current chart, we see an upward movement of the price from the lower green area in the direction of the upper green line. This section describes a yellow channel. Not so long ago, the market reached the intersection of the upper walls of the two channels. But the bulls failed to break through these resistance lines, and they retreated a little. It is possible that the bulls will try again to break through the green resistance line. If the level of 4335.1, which is located on it, is broken, the price may rise a little more to the next resistance level of 4414.7, which is located on the upper yellow line.
Alternatively, it can be assumed that in the next coming trading weeks the price will move in a downward direction to the lower green line. However, we see the lower yellow line on the bears’ way. To confirm the downward trend, a breakdown of the support level of 41454. is necessary. If the support level is broken, the bearish trend can be continued to the lower green line and the support level of 3763.8, which is located on it.
Perhaps we will continue to monitor the index further.


