


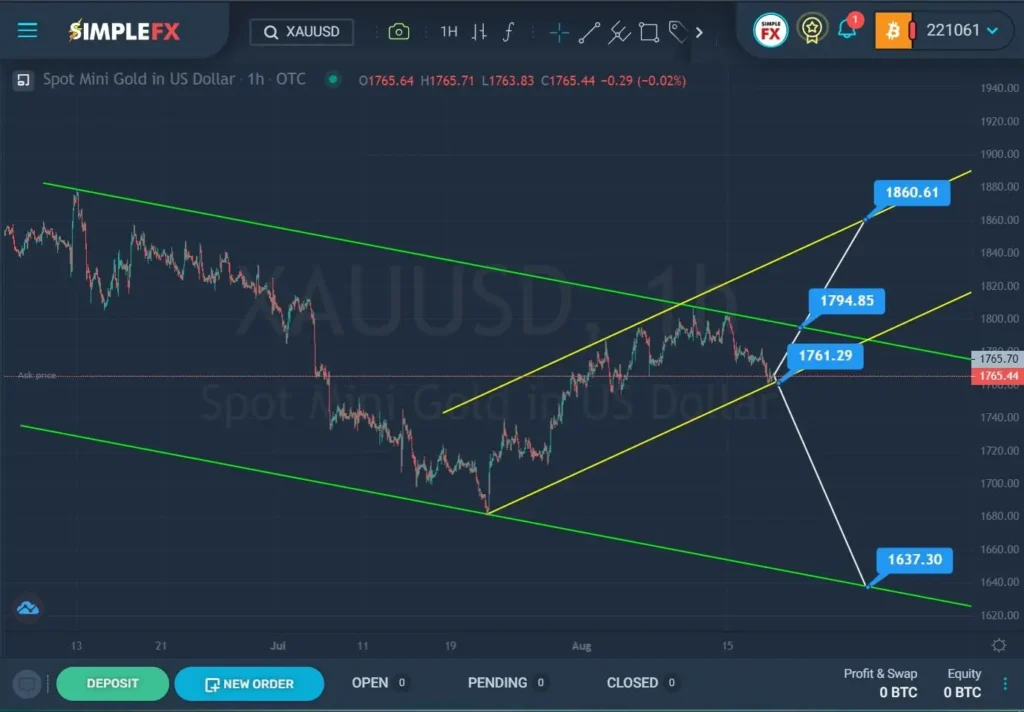

The formation of XAUUSD indicates the development of a large downtrend, which is formed inside a large green channel. After the last rebound from the lower green wall, which occurred in the second half of July, the price began to rise towards the upper green line. This section of the chart describes a yellow channel.
We see that not so long ago the price touched the upper green wall, however, the bulls could not break through the resistance line of the green channel. Therefore, the bears have a chance to take over the market. Such a scenario is possible when the support line of the yellow channel is broken near the level of 1761.29. If this mark is broken, then market participants will expect a fall in the XAUUSD rate in the direction of the lower green line and the support level of 1637.30.
However, at the moment the price is near the upper green wall. If the bulls can bring the market to the resistance level of 1794.85, which is located on the upper green line, and then break through it, then the bulls will open the way to the upper yellow line and the resistance level of 1860.61
An approximate scheme of possible future movement is shown on the chart.
If the upward movement of the price is confirmed, we can consider opening deals for purchases. If a bearish trend is confirmed, then we can make money on sales.


