


The structure of the NDX100 stock index in the 1H timeframe suggests the formation of a global downtrend that moves inside a large green channel.
After the last rebound from the lower green wall in the second half of May, the price continued its upward movement inside the bullish yellow channel, as shown on the chart. Most likely, the bulls are targeting the resistance level of 13828.1, which is located on the upper yellow wall. However, bulls will be able to continue their way to this mark only if they can break through the resistance line of the green channel. That is, if the level of 11951.2 breaks, the price may continue to rise to 13828.1.

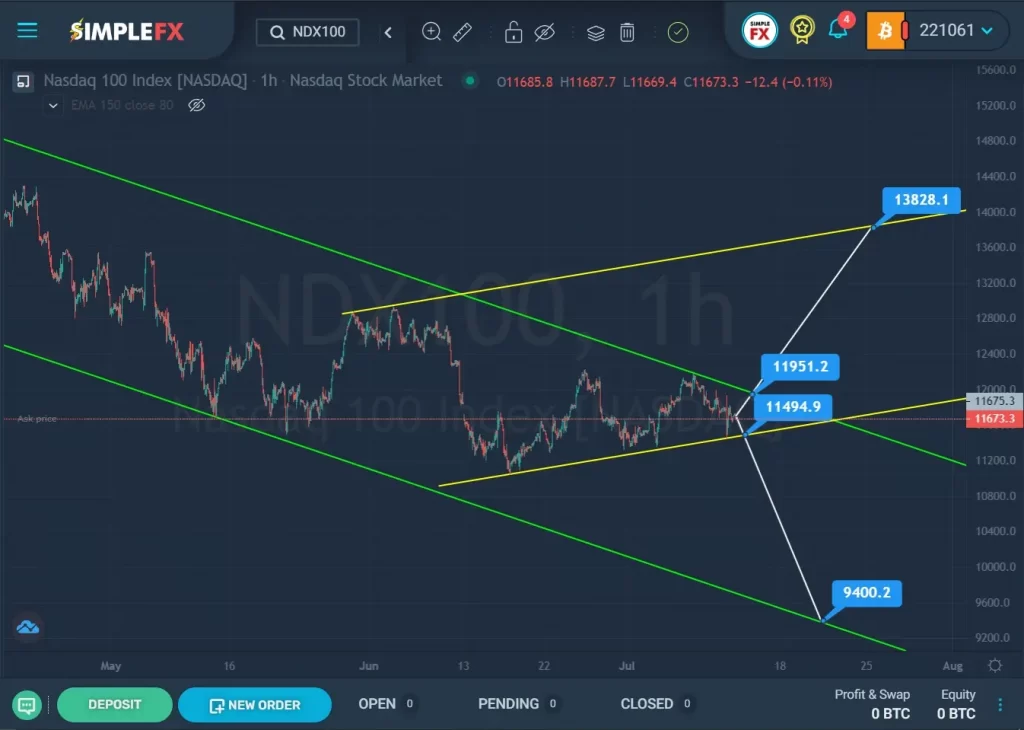
Alternatively, it is assumed that bears can re-bring the market to the support level of 11494.9, which is located on the lower yellow wall, and then break through it. If the specified level is broken, the downward trend will be confirmed, and the fall of quotations will continue to the lower green line and the support level of 9400.2, which is located on it.
With a downward price movement, it is worth considering opening sales deals. When confirming a bullish movement, it is recommended to consider opening deals for purchases.


