


The current structure of the USDCAD pair indicates the formation of an uptrend that moves inside the green channel.
The current chart shows that since mid-May, the market has been moving from the upper green line to the lower green line. After that, the market pushed off from the lower green line and began to move up within the yellow channel. Recently, the price touched the lower yellow line, then we saw a slight rebound from this wall.

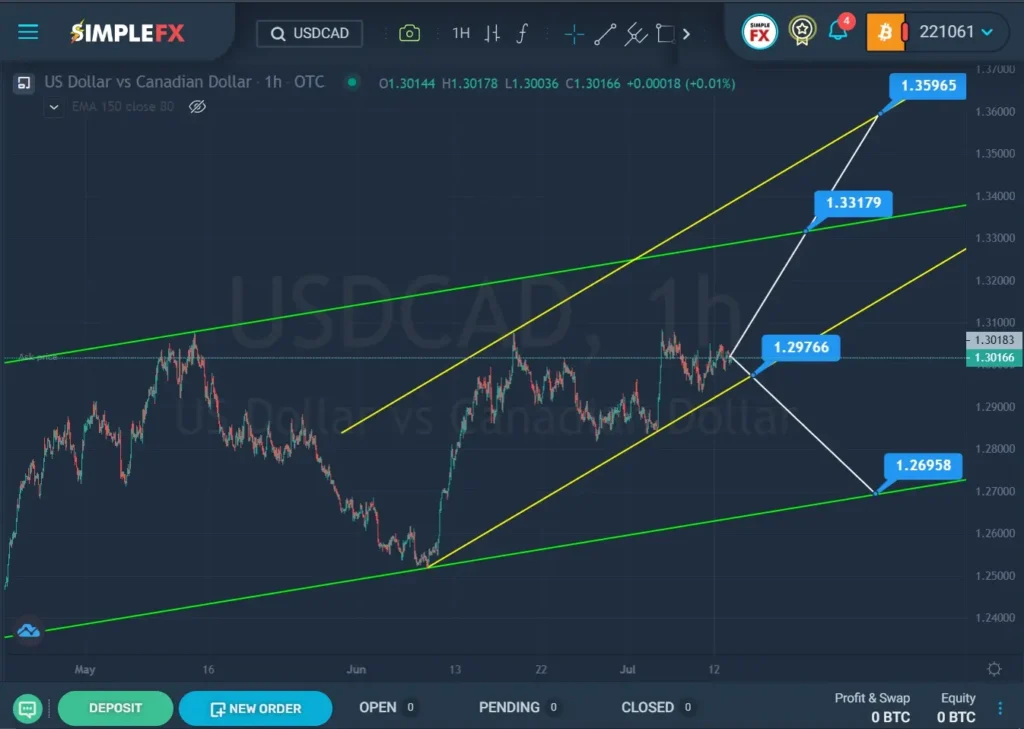
There is a high probability that the bulls will again lead the price up in the direction of the resistance level of 1.331. If this price level breaks, the bullish trend may continue to the next important resistance level of 1.359, which is located on the upper yellow line.
Alternatively, a downward movement of the market is assumed. If the bears are strong enough, there is a risk of a breakdown of the support level of 1.297, especially since the price is very close to this level. If the lower yellow wall is broken, then the downward trend will continue its development in the direction of the lower green line and the support level of 1.269.
If the bullish trend is confirmed, it is recommended to consider opening deals for purchases. If the second option is confirmed on the market, then it is recommended to consider opening sales transactions.


