


The structure of the USDJPY currency pair suggests a global bullish trend that moves within the green channel. And the last section of the chart describes a small yellow channel.
On the current chart, we see that at the end of May, the price touched the lower green wall, and then we saw an upward movement of the market in the direction of the upper green line.

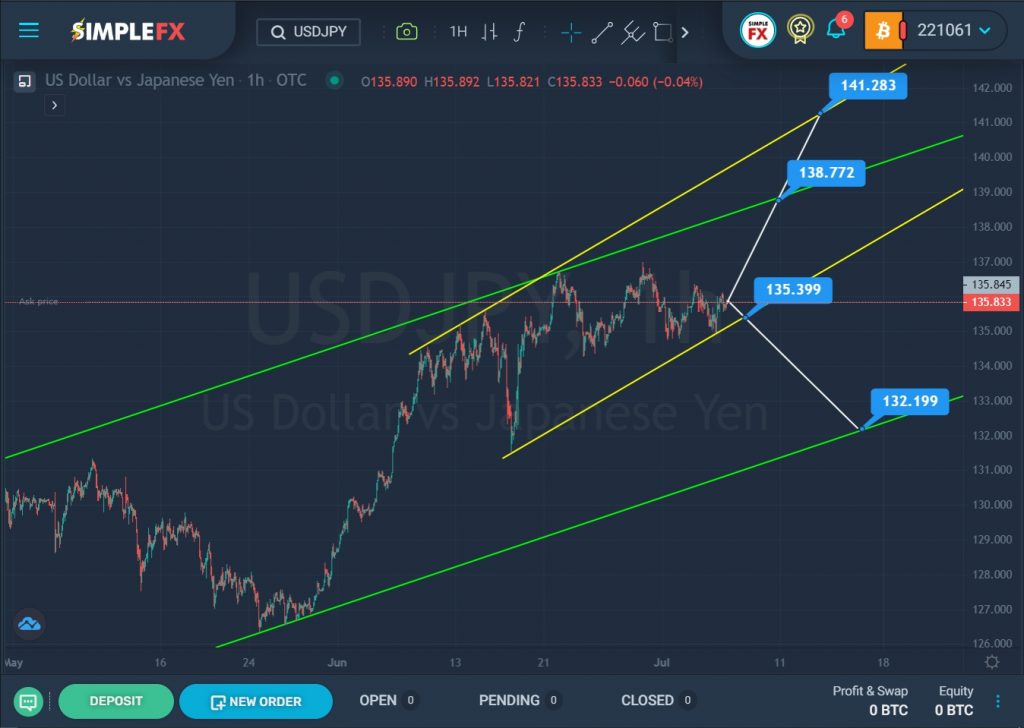
In the last days of June, the bulls brought the market to the upper green wall, but, failing to break through the resistance line, they lost to the bears. However, it can be noted that at the moment the price is moving sideways, which means that the bears are not strong enough yet. Thus, the bulls still have a chance to try again to break through the green upper wall.
Most likely, with the same growth rate as it was before the flat was built, the bulls will be able to break through the resistance level of 138.77, located on the upper green line. In this case, market participants expect an increase to a higher resistance level of 135.29, located on the upper yellow line.
Alternatively, it is assumed that the price will continue to move in a downward direction to the lower yellow line. With a successful breakdown of the support level of 135.39, the bears will open the way to the lower green line and the support level of 132.19.


