


The internal USOIL structure on the current chart suggests the construction of a large bearish trend that moves within the green channel.

SimpleFX USOIL Chart Analysis: July 6, 2022.
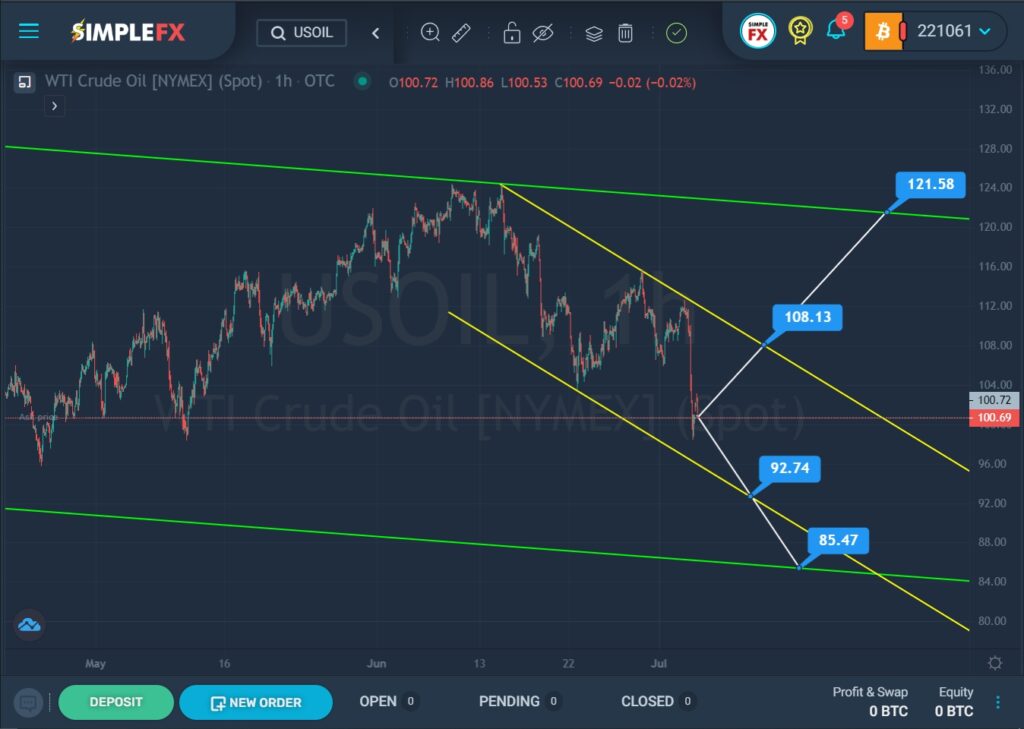
Here we see that since the beginning of May, the market has been moving in an upward direction from the lower green area toward the upper green line. The price reached the upper green wall in mid-June, but the bulls did not have enough strength to break through the resistance line, so soon the bears entered the market and led the price. The last section of the price describes a yellow channel.
In the coming trading weeks, we expect the USOIL price to continue falling to the lower green line. Most likely, the bears are targeting the support level of 85.47. However, we see a yellow resistance line on the way of the bears. To continue the bearish trend, it is necessary to wait for the breakdown of the 92.74 level, located on the lower yellow wall.
Alternatively, an upward movement in the oil price is expected. In the near future, growth to the upper yellow line and the resistance level of 108.13 is possible. If this level breaks, the market may rise to the next important resistance level of 121.58, which is located on the upper green line.
When confirming the bearish movement of the market, it is recommended to consider opening sales transactions. With an upward price movement, we can continue to open long positions.


