


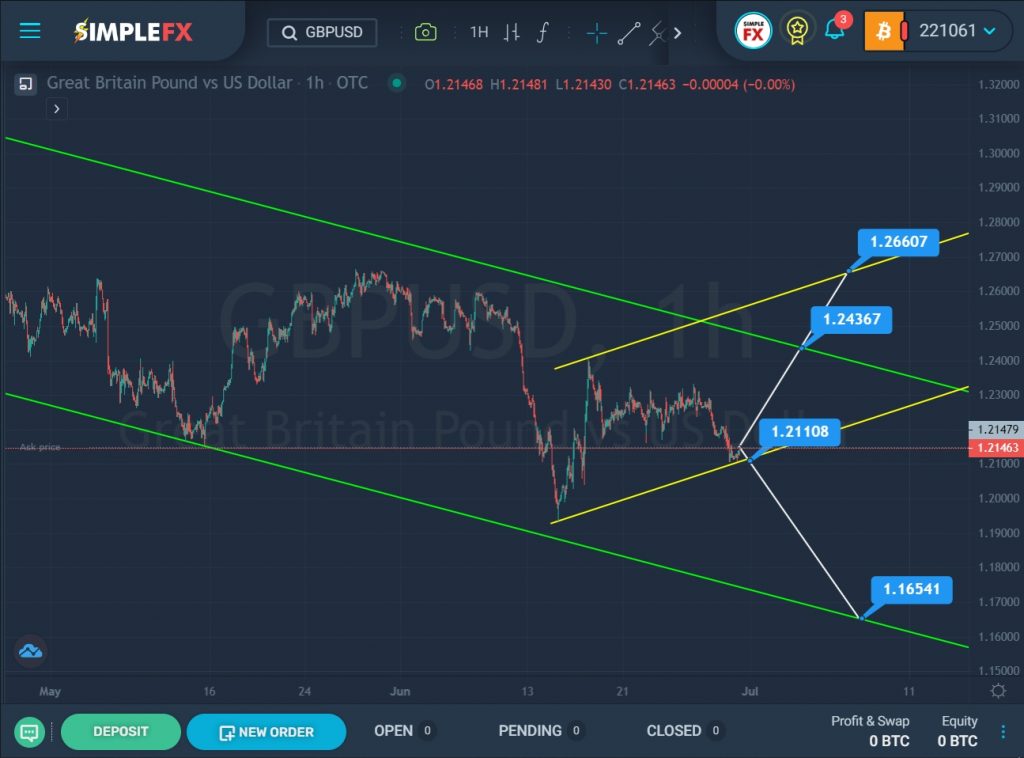
The formation of the GBPUSD currency shows a downward movement of the market within a large green channel.

Roman Onegin <romanoneginforecast@gmail.com>
Attachments
8:17 AM (3 hours ago)
to bartlomiej.ciszewski
SimpleFX GBPUSD Chart Analysis: June 30, 2022
In the second half of May this year, the price reached the lower green line. We see that the bears failed to break through the support line, so the price, pushing off from the green line, began to move in the opposite direction. At the end of April, the price, having reached the upper green area, turned around and sharply collapsed in the direction of the lower green wall. However, like the bulls, the bears could not bring the market to the support line, and the price turned around again. The last ascending section describes a yellow channel.
Two scenarios are assumed – the continuation of the upward movement, or the continuation of the main downward trend.
The first option will be confirmed if the price moves up in the direction of the upper green line. If the resistance level of 1.243 breaks, the growth may continue to the upper yellow line and the resistance level of 1.266, which is located on the upper wall of the yellow channel.
In the second view, market participants will see a downward movement of the currency in the direction of the lower yellow line and the support level of 1.211. With a successful breakdown of the specified price mark, the downward trend can be continued in the direction of the lower green line and the support level of 1.165.


