


For the EURUSD currency, we can see the construction of a large downtrend that moves inside the green channel.
On the current chart, we see the market movement from the beginning of May to the present day. At the beginning of May, the price pushed off from the lower green line, after which, over the next month, the pair moved in an upward direction to the upper line of the green line. However, the bulls did not overcome the green resistance line.

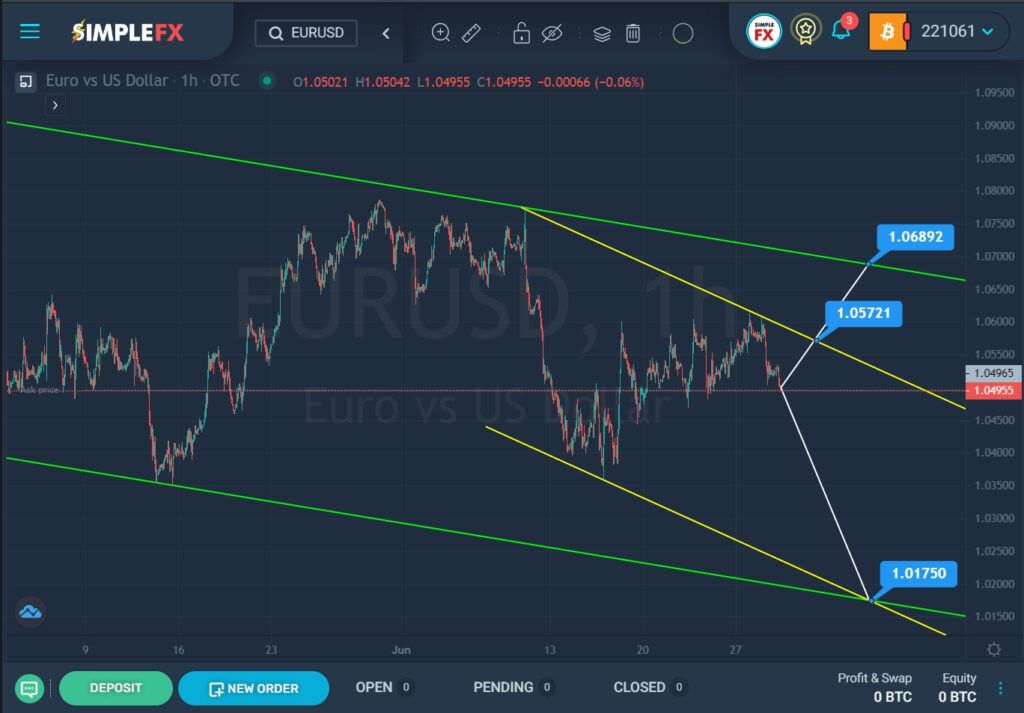
In the first half of June, the market pushed off this line and began to move downward within the yellow channel. Recently, the price touched the lower yellow wall, but then the market turned sharply and began to quickly gain momentum and move up.
It is assumed that the bulls will continue to push the price up. In this case, the currency pair may continue to grow in the direction of the resistance level of 1.057. If this price level is broken, the path to the upper green line and the resistance level of 1.068 will become free for the pair.
Alternatively, the market is expected to move down to the lower yellow line and the support level of 1.017. This level is also located on the lower green line.
With a bullish market movement, it is possible to consider opening deals for purchases. In case of bearish market movement, it is recommended to consider opening sales transactions.


