


For the GBPJPY currency, it is assumed that a downward trend is forming, which moves inside the green channel. The current chart shows the market movement since mid-April of this year.
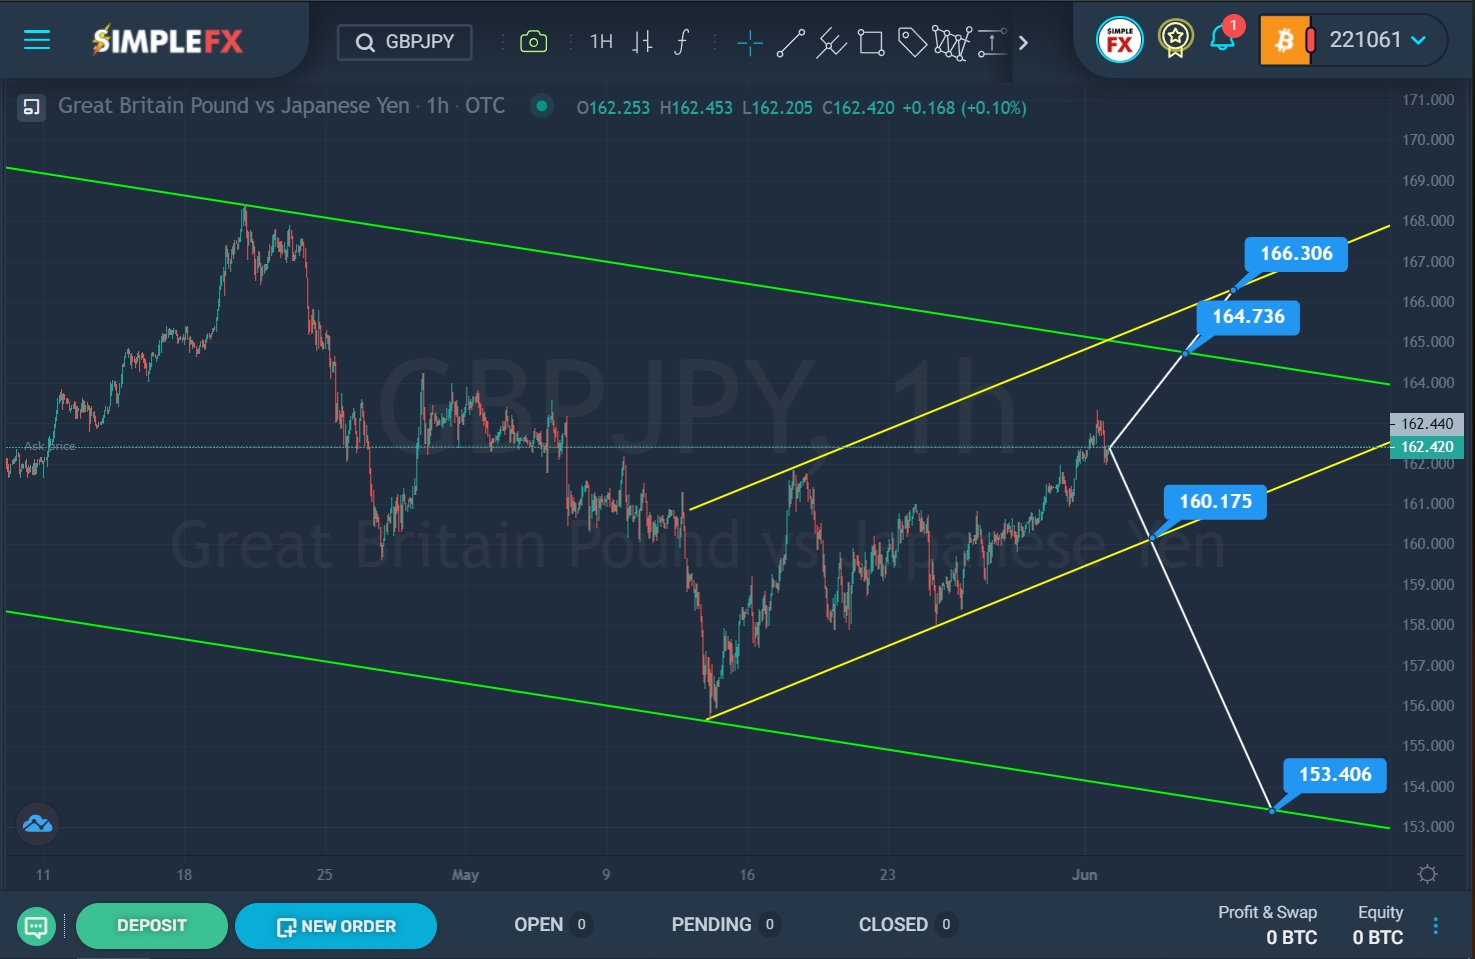

SimpleFX GBPJPY Chart Analysis: June 2, 2022.
In the second half of April, the price touched the upper green line, then it pushed off from it and began to fall in the lower green wall. By mid-May, the market reached the lower green wall, but the bears failed to break through it, so the price began to move in the opposite direction. The last ascending segment of the market moves inside the yellow channel.
Currently, the market is located in the upper green area. It is assumed that the price will soon reach the upper green line. If the bulls can break through the resistance level of 164.73, then the pair will continue to creep up to the next resistance level of 166.30, which is located on the upper yellow wall.
Alternatively, it is assumed that the bears may make another attempt to break through the lower yellow line. We see that two attempts have already been made to break through the yellow support line. With a successful breakdown of the support level of 160.17, market participants can expect the development of a bearish trend in the direction of the lower green line and the support level of 153.40.
An approximate scheme of possible future price movement is shown by trend lines.


