


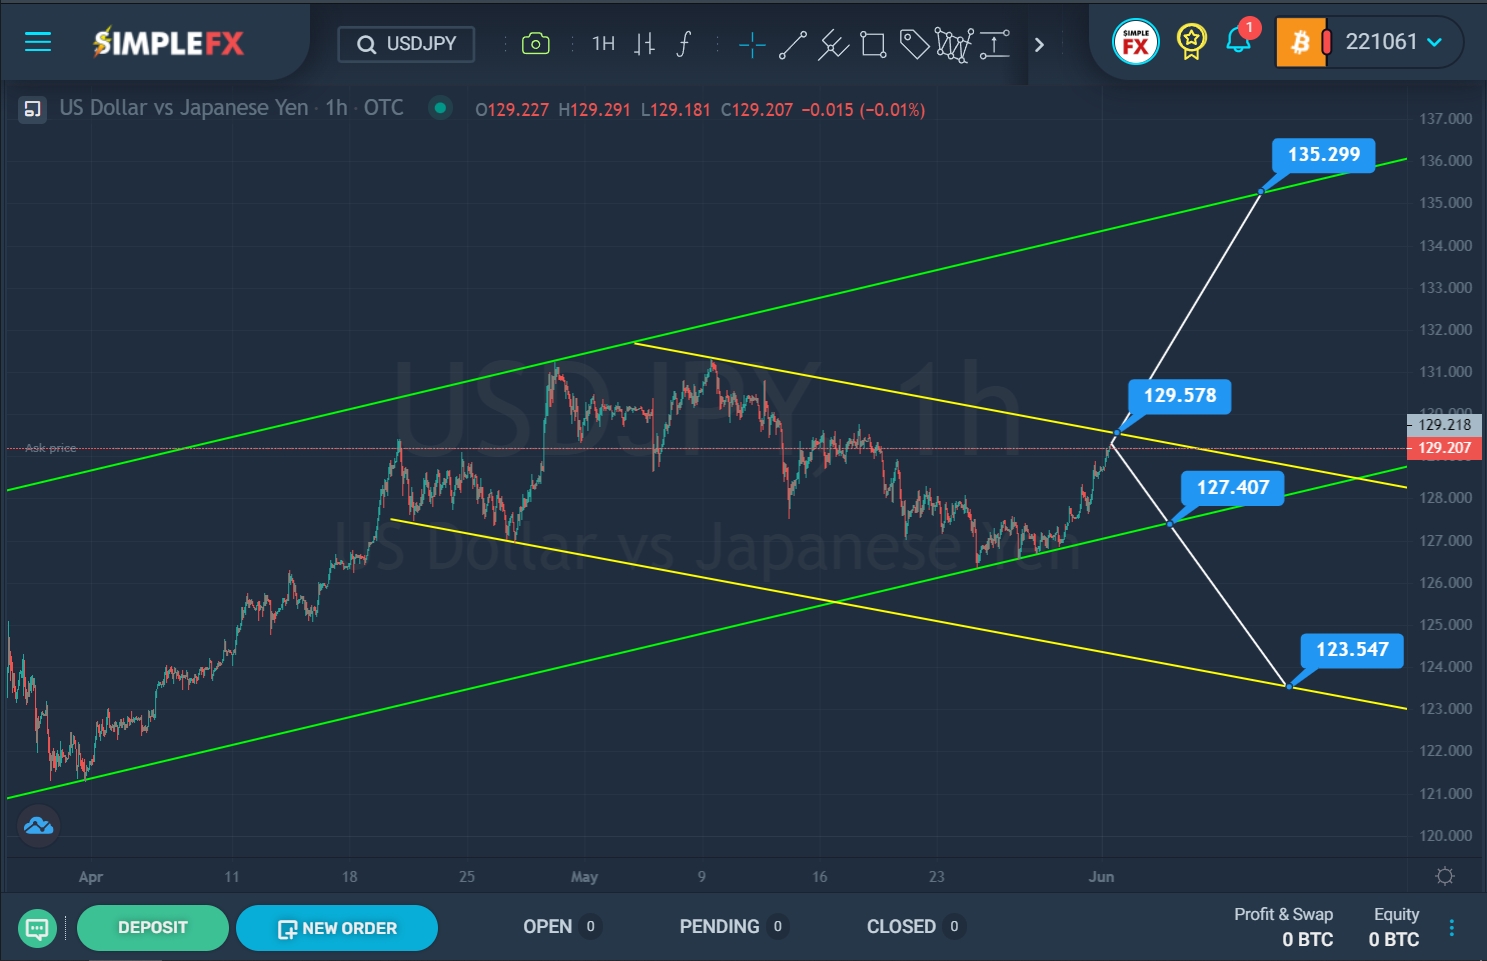
The current formation of the USDJPY currency pair suggests a global bullish trend that moves within the green channel.

SimpleFX USDJPY Chart Analysis: June 1, 2022.
After the last pullback from the upper green wall, we saw a decrease in the lower green line. This period of the chart describes the descending channel of yellow color. Recently, the price touched the lower green wall, and then we saw an upward movement of the market toward the upper green line.
With the same growth rate, bulls will be able to break through the resistance level of 129.57, located on the upper yellow line. In this case, market participants will expect an increase to a higher resistance level of 135.29, which is located on the upper green line.
Alternatively, it is assumed that the price will repeatedly move downward to the lower green line. With a successful breakdown of the support level of 127.40, the bears will open the way to the lower yellow line and the support level of 123.54.
An approximate scheme of possible future movement is shown on the chart.
When the market is bullish, it is recommended to consider opening long positions. If the price falls, we can consider opening sales orders.


