


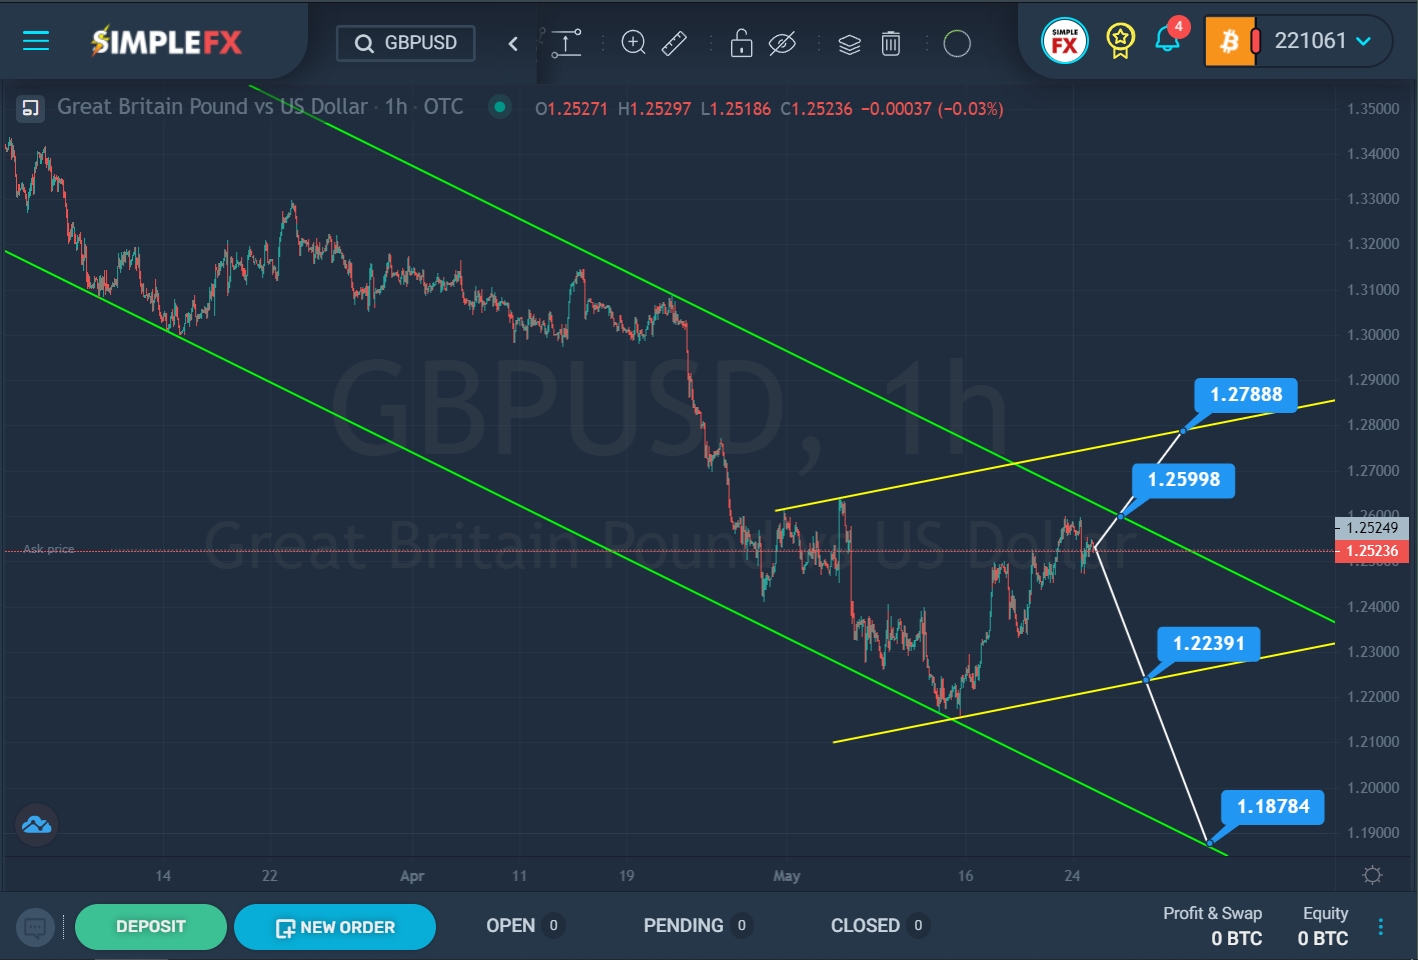
The formation of the GBPUSD currency shows the downward movement of the market within a large green channel.

SimpleFX GBPUSD Chart Analysis: May 25, 2022
In the second half of March, the price reached the lower green line. We see that the bears failed to break through the support line, so the price, pushing off from the green line, began to move in the opposite direction. At the end of April, the price, touching the upper green line, sharply collapsed in the direction of the lower green wall. The last section of the chart describes an ascending channel of yellow color.
Two scenarios are assumed – the continuation of the upward movement, or the continuation of the main downward trend.
The first option will be confirmed if the price moves up in the direction of the upper green line. If the resistance level of 1.259 breaks, the growth may continue to the upper yellow line and the resistance level of 1.278, which is located on the upper wall of the yellow channel.
In the second view, market participants are waiting for a downward movement of the currency in the direction of the lower yellow line and the support level of 1.223. With a successful breakdown of this price mark, the downward trend can be continued in the direction of the lower green line and the support level of 1.187.
An approximate scheme of possible future movement is shown on the chart.


