


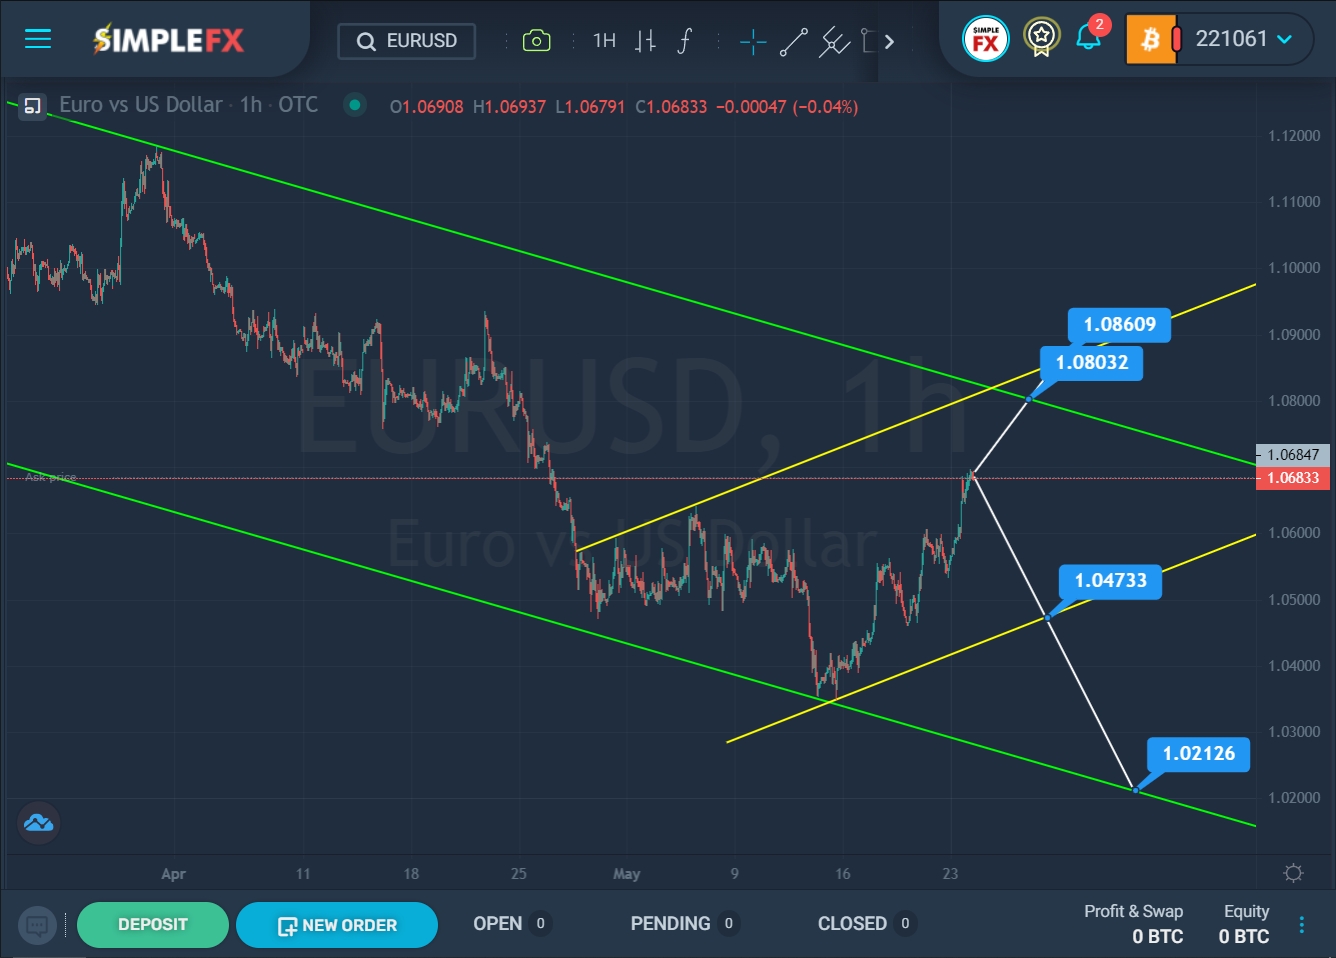
The current EURUSD formation suggests the construction of a large downtrend that moves inside the green channel.

SimpleFX EURUSD Chart Analysis: May 24, 2022.
We see the market movement from the end of March to today on the current chart. The bulls reached the upper green line at the end of March, but could not break through it. Thus, the market pushed off from this line and began to move in a downward direction. Recently, the price touched the lower green wall, but then the market turned sharply and began to quickly gain momentum and move up. This section of the chart describes a bullish yellow channel.
It is assumed that the bulls will continue to push the price up. In this case, the currency pair may continue to grow in the direction of the upper green line and the resistance level of 1.080. If this price level is broken, a path will open for the pair to the upper yellow line and the resistance level of 1.086.
Alternatively, the market is expected to move down to the lower yellow line and the support level of 1.047. If this price level is broken, the Eurodollar will continue to fall to the lower green wall and the support level of 1.021.
With a bullish market movement, we can consider opening purchase orders. In case of bearish market movement, it is recommended to consider opening sales orders.


