


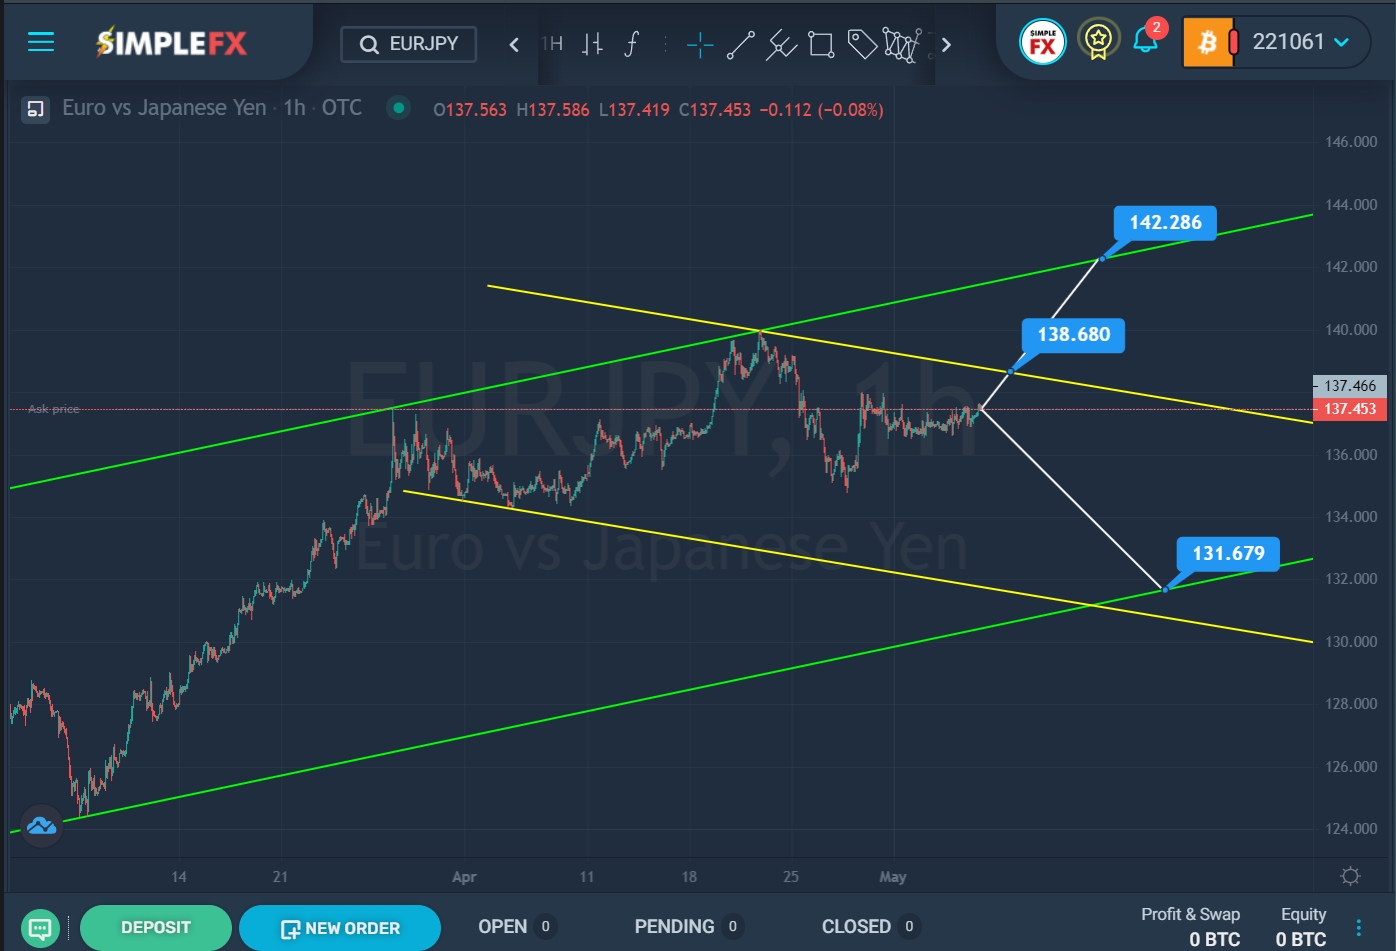
We see a large uptrend for the EURJPY currency pair that moves within the green channel. We see the price movement from March to today on the current chart.

SimpleFX EURJPY Chart Analysis: May 6, 2022
In the first half of March, the price touched the lower green line, then pushed off from it and we saw an increase in the value of quotations to the upper green line. By the end of March, the bears brought the pair to the upper green wall, but they failed to break through it.
Throughout April, we observe price movement in the upper green area. Bulls in the last days of April made a second attempt to break through the green resistance line, however, unsuccessfully.
The last section of the chart describes a descending yellow channel. Currently, the market is located near the upper yellow line. It is assumed that after the breakdown of the resistance level of 138.68, the price will begin to rise again to the resistance level of 142.28, which is located on the upper green line.
However, the last bounce from the upper line of the green channel may give strength to the bears. Thus, in the upcoming trading days, the market may move down in the direction of the lower green wall and the support level of 131.67, as shown on the chart.


