


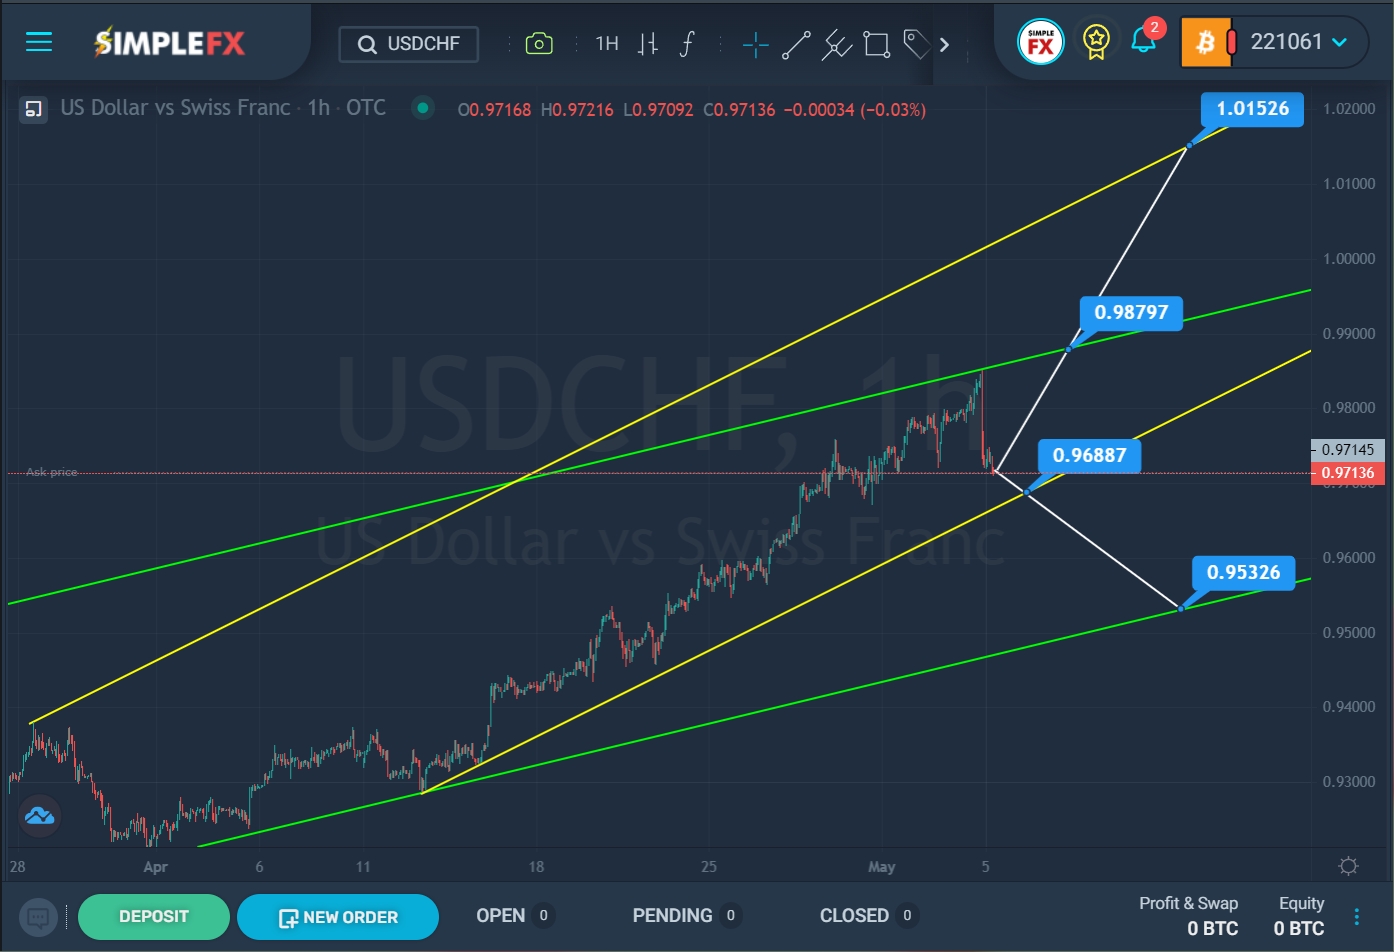
The current formation of the USDCHF currency hints at the construction of an upward trend that moves within the green channel. The ascending section, which has been forming since the beginning of April, describes an ascending channel of yellow color.

SimpleFX USDCHF Chart Analysis: May 5, 2022
Having pushed off from the lower green wall in mid-April, we see that the price rose to the upper green line in a month. Recently, it touched the upper green wall, but so far the bulls have not broken through the resistance line. Perhaps in the near future, we will see a repeated upward movement of the market to the green line, and if the resistance level of 0.987 breaks, the USDCHF pair may continue to grow to the next important level of 1.015, which is located on the upper yellow line. In the current situation, it is possible to consider opening long positions.
Alternatively, it is assumed that the last rebound from the upper wall of the green channel may serve to start a bearish trend. This assumption will be confirmed at the breakdown of the support level of 0.968, which is located on the lower yellow line. In this case, market participants may expect a price drop in the direction of the support level of 0.953, which is located on the lower green wall. In the current situation, it is possible to consider opening short positions.
An approximate scheme of possible future movement is shown on the chart.


