


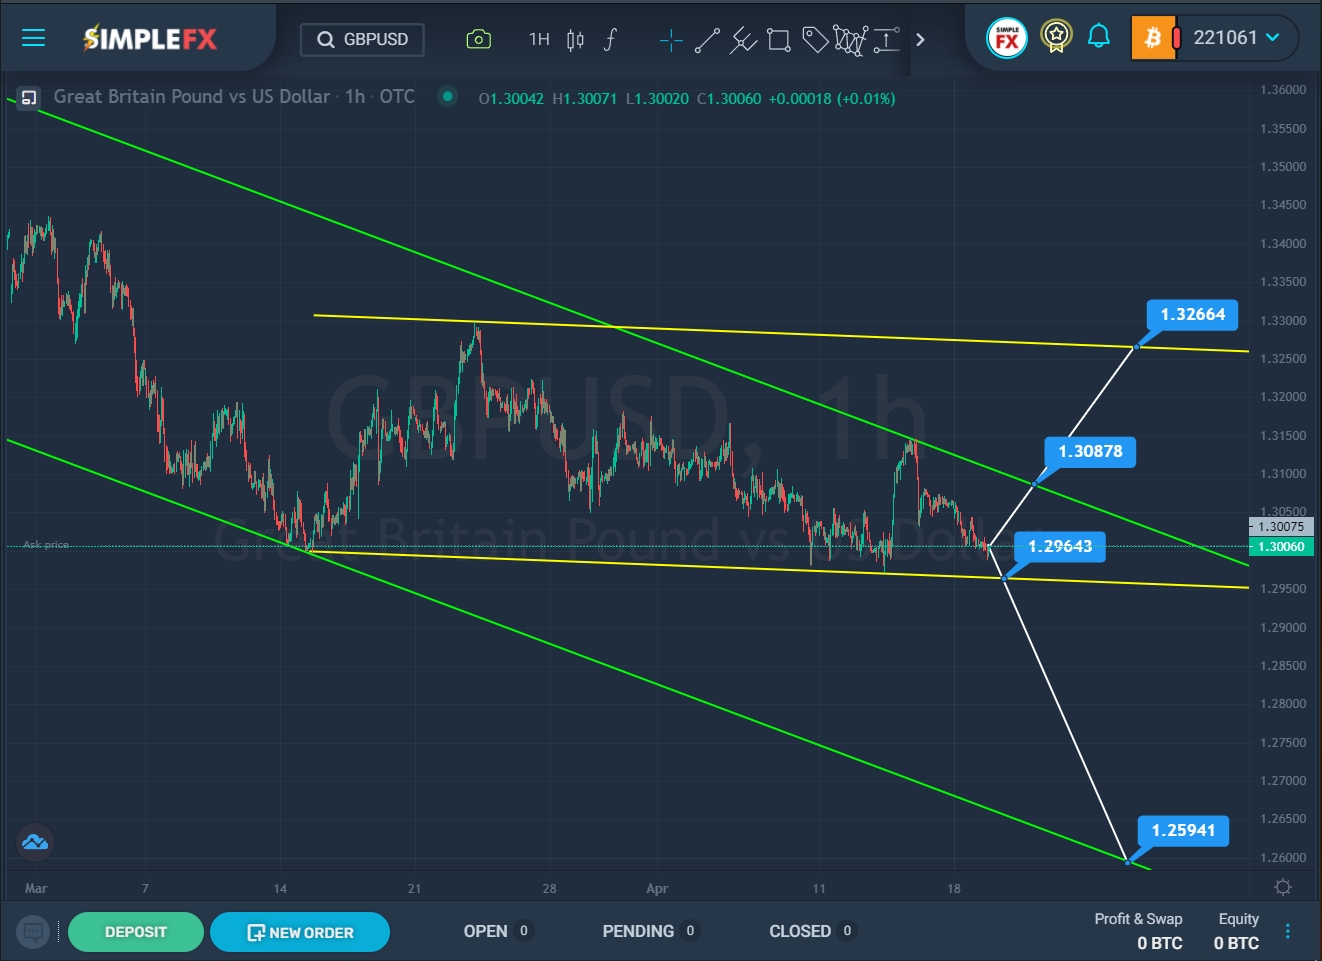
The GBPUSD currency pair seems to be forming a downward movement within a large green channel.

SimpleFX GBPUSD Chart Analysis: April 19, 2022
The price reached the lower green line in the second half of March. We see that the bears failed to break through the support line, so the price, pushing off from the green line, began to move in the opposite direction. However, we are not seeing rapid growth. The last section of the chart looks more like a flat, which moves inside the horizontal yellow channel with a slight downward slope.
Two scenarios are assumed, either the continuation of the construction of the horizontal figure or the continuation of the main downward trend.
The first option will be confirmed if prices move up in the direction of the upper green line. If the resistance level of 1.308 breaks, the growth may continue to the upper yellow line and the resistance level of 1.326, which is located on the upper wall of the yellow channel.
In the second variant, the horizontal price movement can be completed if the bears break through the lower yellow wall near the support level of 1.296. With a successful breakdown of this price mark, the downward trend can be continued in the direction of the lower green line and the support level of 1.259.
An approximate scheme of possible future movement is shown on the chart.


