


For the main currency EURUSD, we see the construction of a large downtrend, which moves inside the green channel.
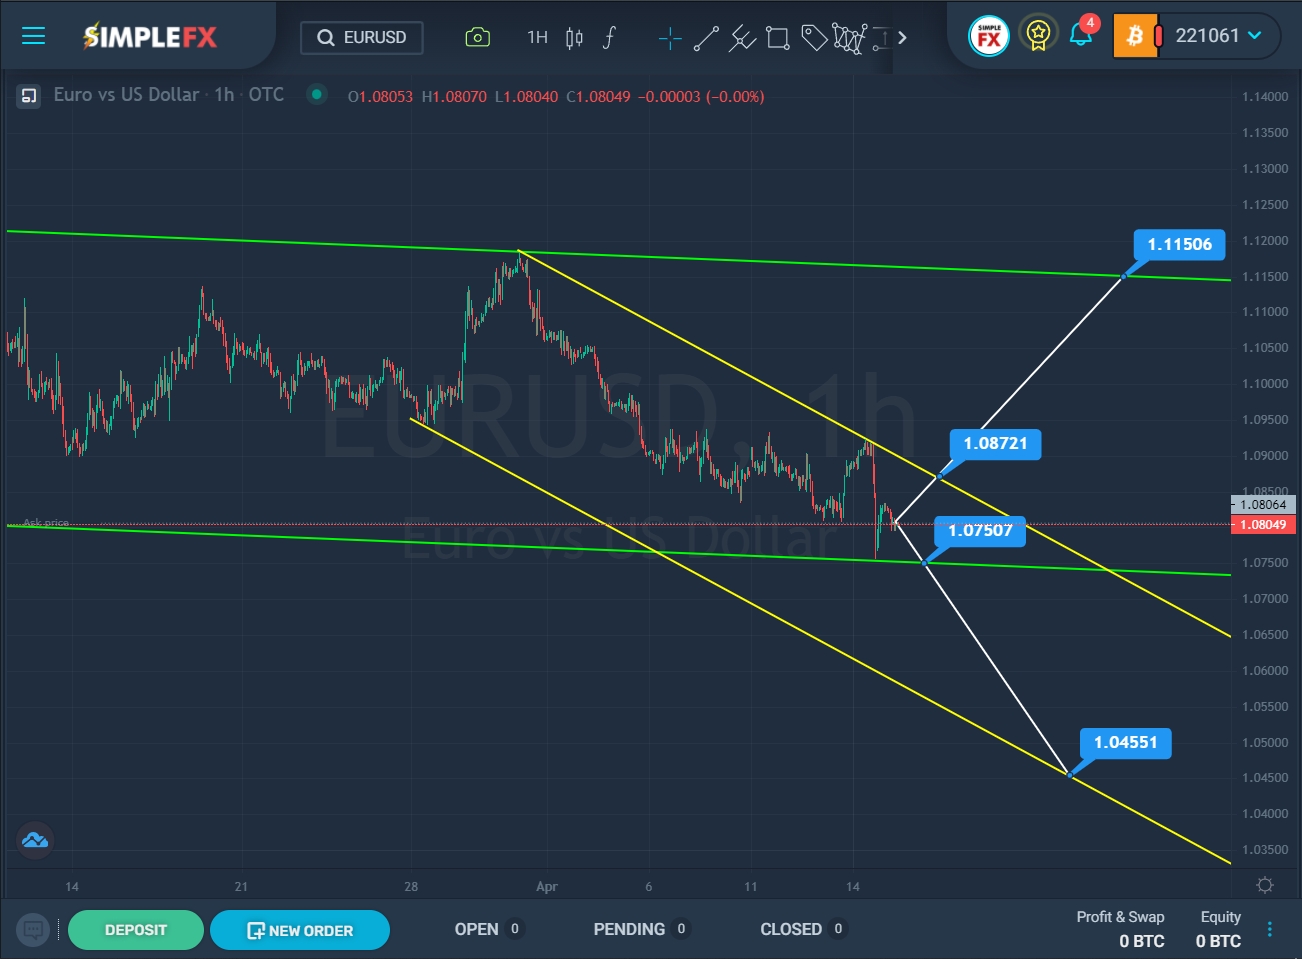

SimpleFX EURUSD Chart Analysis: April 15, 2022
On the current chart, we see the market movement from the second half of March to today. The bulls reached the upper green line at the end of March, but could not break through it. Thus, the market pushed off from this line and began to move in a downward direction. Recently, the price touched the lower green wall, this section of the chart describes a yellow bearish channel.
Not so long ago, the price pushed off from the upper resistance line of the yellow channel, but the price was restrained by the support line of the green channel. It is assumed that the bulls will continue to push the price up. In this case, the currency pair may continue to grow in the direction of the upper green line and the resistance level of 1.1150. However, first, the bulls need to break through the yellow resistance line of 1.0872.
Alternatively, the market is expected to move down inside the yellow channel to the lower green line and the support level of 1.0750. If this price level is broken, the Eurodollar will continue to fall towards the lower yellow wall and the support level of 1.0455.
With a bullish market movement, it is possible to consider opening deals for purchases. When confirming a bearish movement, we can consider opening short positions.


