


The current structure of oil suggests the construction of a large uptrend that moves within the green channel.

SimpleFX USOIL Chart Analysis: March 17, 2022.
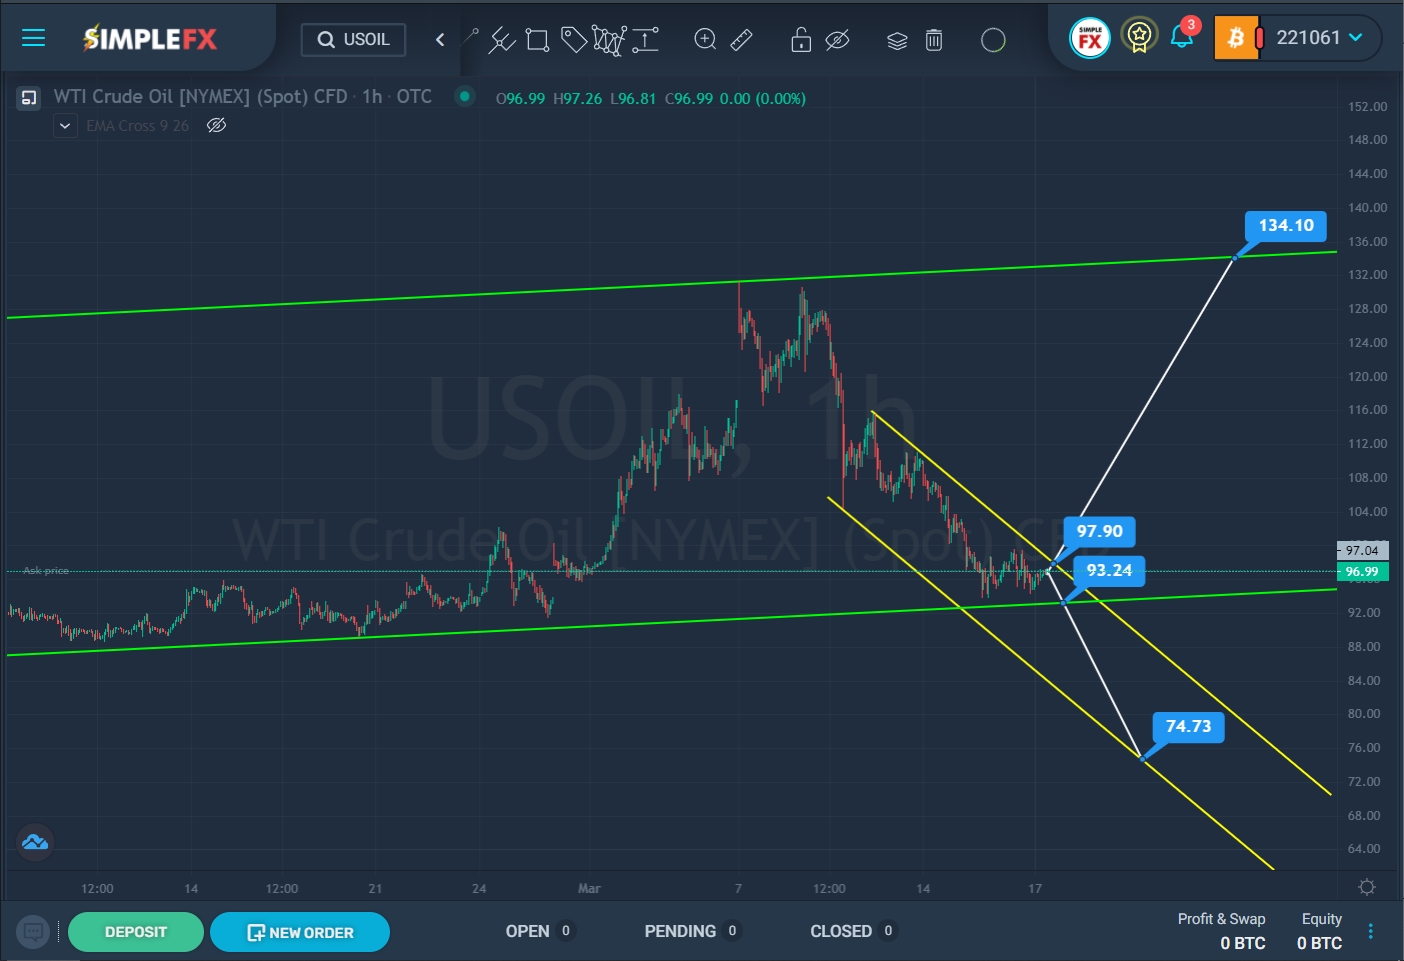
We see that the price has been steadily creeping upward from the lower green line to the upper green line for about a month on the current chart. In early March, the price touched the upper green wall. We see that the bulls did not break through the resistance line, and the price began to move in the opposite direction.
In the upcoming trading weeks, market participants may see a continuation of the fall in the value of USOIL within a small yellow channel. Most likely, the bears are targeting the support level of 93.24, which is located on the lower green line. If this level breaks, the price may continue to move down to the lower yellow wall and the support level of 74.73.
Alternatively, the price of oil may rise a little more, and then there is a chance that the bulls will break through the resistance level of 97.90, which is located on the upper yellow wall. With a successful breakdown of this level, the price may rise to the next resistance level of 134.10, which is located on the upper green line.
When confirming the bearish movement of the market, it is recommended to consider opening sales transactions. With an upward price movement, we can continue to open long positions.


