


For XAUUSD, we see the development of a large uptrend, which is formed inside a large green channel. In the last section of the chart, we see a downward price movement inside a small yellow channel, which began at the beginning of this month.
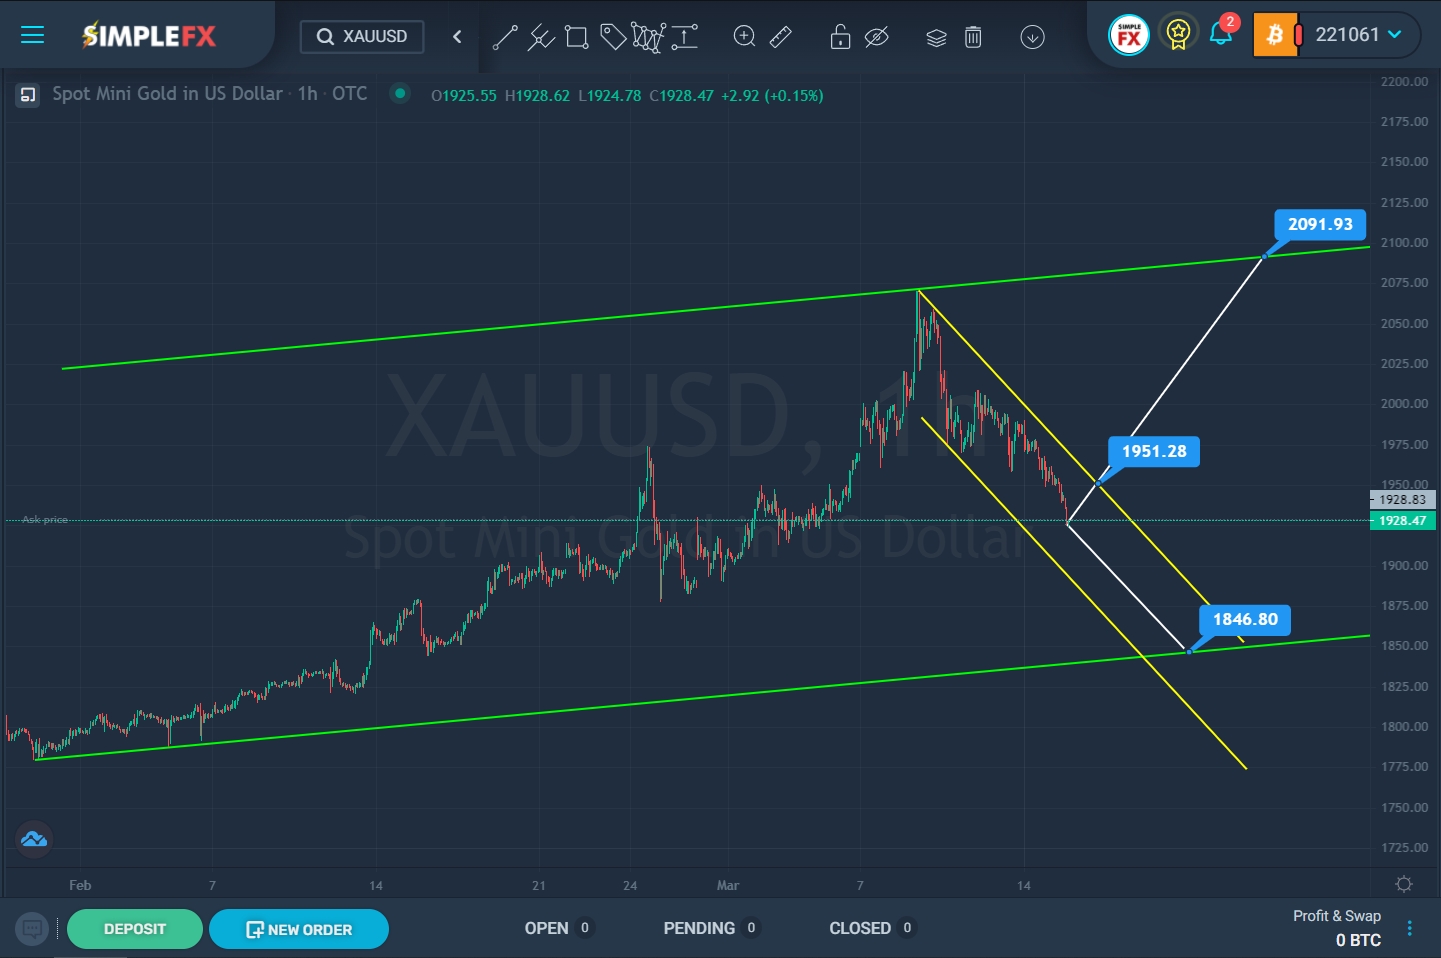
SimpleFX XAUUSD Chart Analysis: March 15, 2022.

There is a high probability that the depreciation of XAUUSD will continue in the following weeks. It is possible that the bears are targeting the support level of 1846.80, which is located on the lower green line. In this case, the market will move within the yellow channel.
However, there is a possibility that the price will start moving up, in which case the resistance level of 1951.28, which is located on the upper yellow line, may be broken. If this scenario is confirmed, the way will open for the bulls to the upper green line and the resistance level of 2091.93. If the upper yellow line is not broken, the price will push off from it and continue moving according to the first scenario, that is, down.
An approximate scheme of possible future movement is shown on the chart.
When confirming the upward movement of the price, we can consider opening deals for purchases. If a bearish trend is confirmed, then we can make money on sales.


