


The NDX100 stock index suggests the formation of a global downward horizontal trend that moves inside a large green channel.

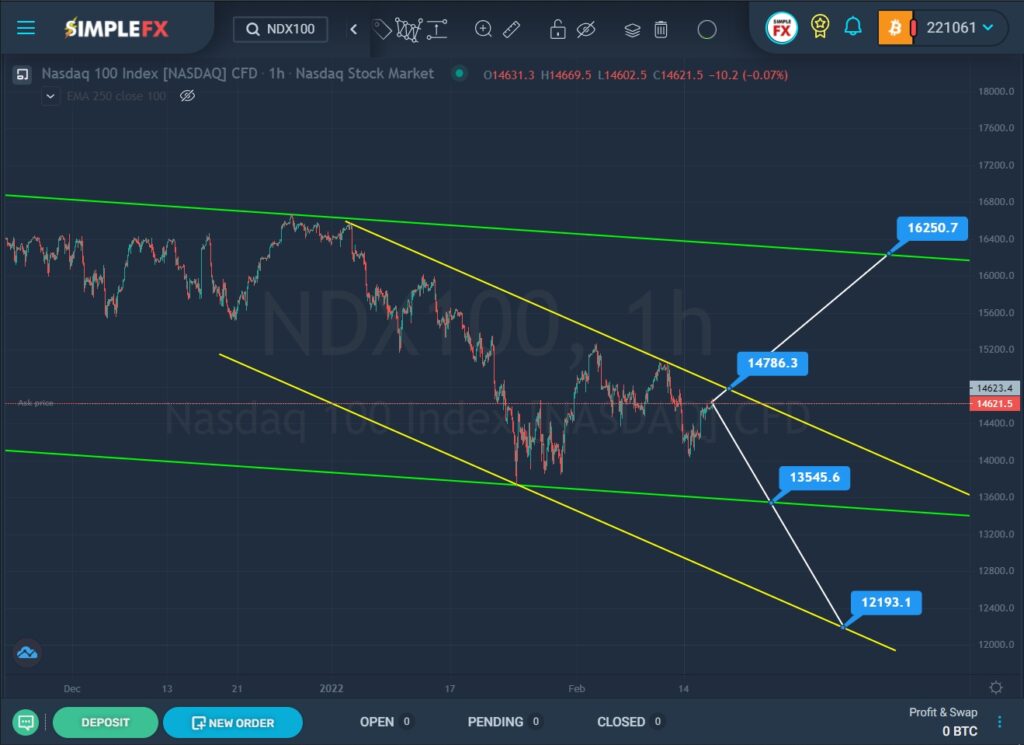
As shown on the chart, there is a high probability that the market will form a downward trend inside the yellow bearish channel in the near future. To confirm this forecast, bears must break through the lower green wall. Currently, the market is in the lower green area, so the bears have every chance to bring the market to the support level of 13545.6, and then break through it. If this level is broken, the downtrend will be confirmed, and the price will begin to fall towards the lower yellow wall and the support level of 12193.1, which is located on it.
Alternatively, growth is assumed in the direction of the upper yellow wall and the resistance level of 14786.3. If this price level is broken, the NDX100 index may rise to the next resistance level of 16250.7, which is located on the upper wall of the green channel.
With a downward price movement, it is worth considering opening sales deals. When confirming a bullish movement, it is recommended to consider opening deals for purchases.


