


The current formation of the USDCAD currency pair indicates that an upward price movement is being formed, which began after the rebound from the lower line of the yellow ascending channel.

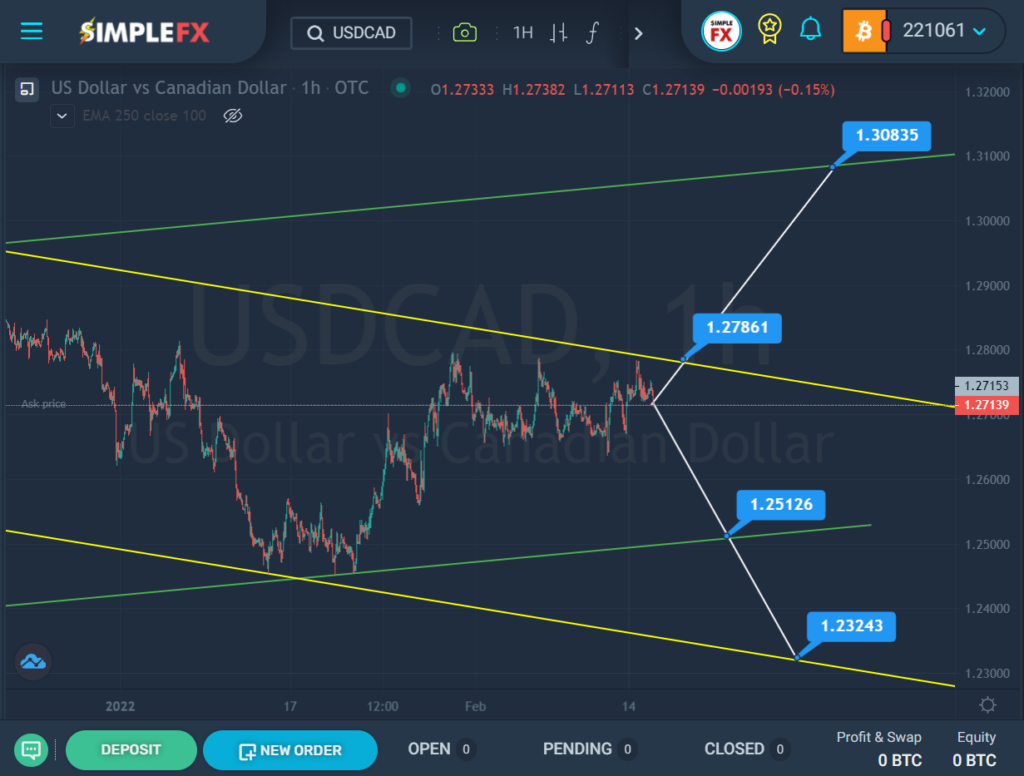
It is possible that the upward trend will continue until the resistance level of 1.278, which is located on the upper yellow line, is reached. (The yellow channel describes the currency pair’s movement over the past two months). If the bulls are able to break through the specified level, then a path will open for them to the upper green wall and the resistance level of 1.308.
However, it is worth taking into account an alternative scenario in which the bearish direction of the price is assumed. In this case, market participants will collapse to the lower green line. With a greater pressure of bears, there is a risk of a breakdown of the support level of 1.251. If the lower green wall is broken, then the downward trend will continue to develop in the direction of the lower yellow line and the support level of 1.232.
When confirming the bull market, it is recommended to consider opening deals for purchases. If the second option is confirmed on the market, then it is recommended to consider opening sales transactions.
An approximate scheme of possible future movement is shown on the chart.


