


For the LTCUSD cryptocurrency pair, we see the formation of a global downtrend that moves within the green channel.
On the current chart, we see that the market has been moving in the upper green area for a long time, and in mid-January, the bulls finally touched the upper green line. However, the bulls were unable to break through this line.

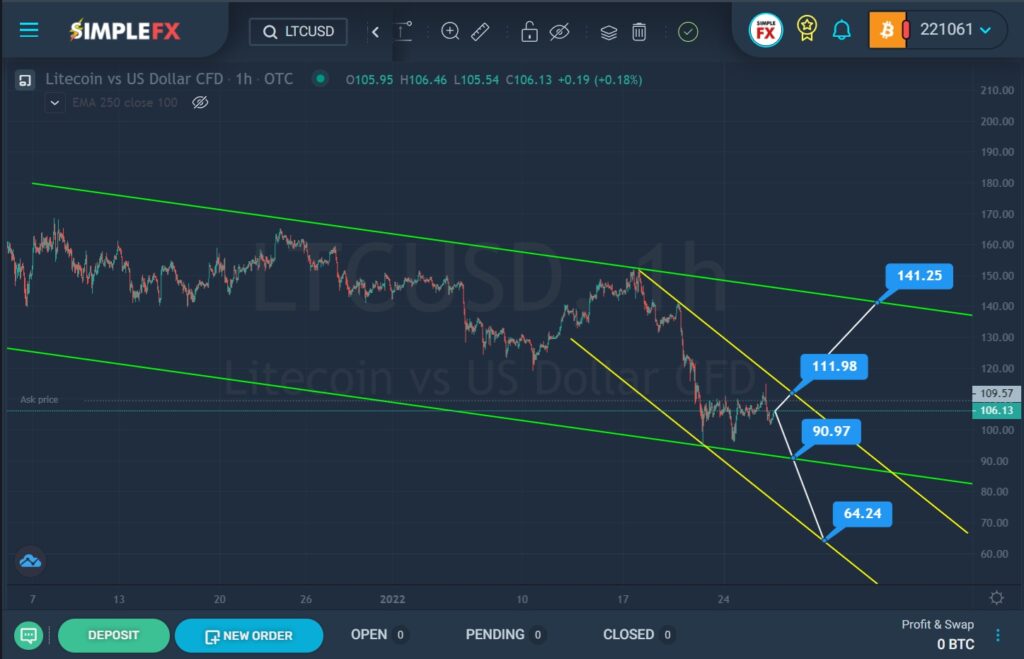
The last section of the chart describes a descending yellow channel, on which we see a rapid drop of the cryptocurrency to the lower green line. A few days ago, the price touched the lower green wall but then went into a reversal.
Currently, the market is close to the upper yellow wall. There is every chance that the price will continue to rise. In the event of a breakdown of the resistance level of 111.98, the bulls are likely to continue to push the price to the upper green line and the resistance level of 141.25.
Alternatively, it is assumed that the market is moving down to the lower green line and the support level of 90.97. If the bears break through this level, then the price will fall even lower to the next support level of 64.24, which is located on the lower yellow line.
With a bullish price movement, it is recommended to consider opening deals for purchases. In a downtrend, it is worth thinking about sales deals.


