


The current formation of BMW.DE shares hints at a global uptrend that is moving within a large green channel.
At the end of August, we saw how the price pushed off from the lower green line and smoothly began to rise to the upper green line within the ascending yellow channel. Not so long ago, the price reached the upper green wall, after which it pushed off from it and began to move in the opposite direction.

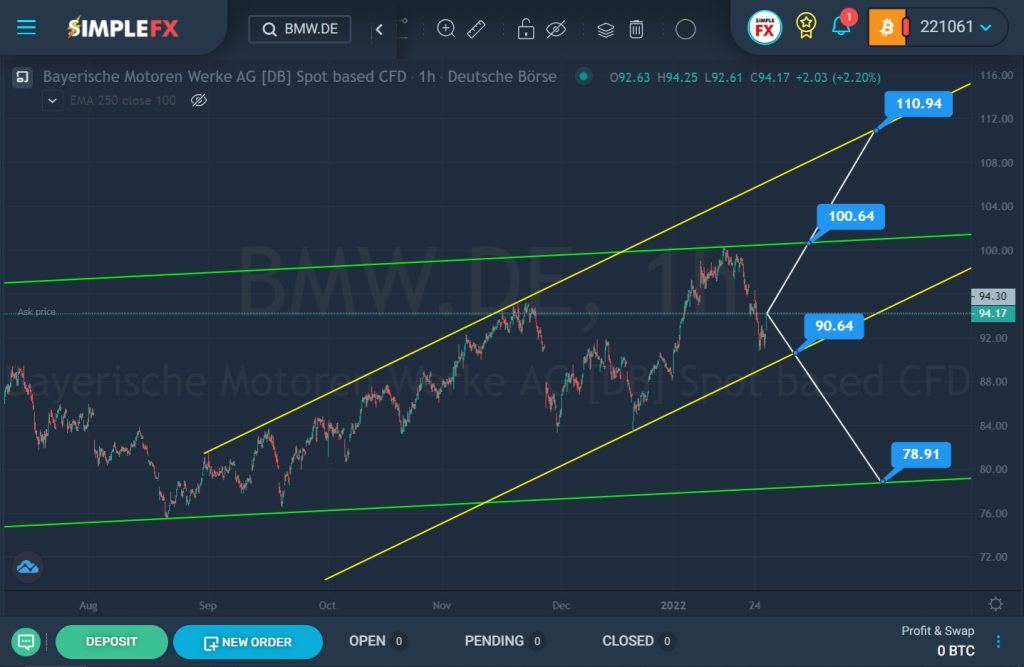
Now the price is near the lower yellow line. There is a possibility that the bears will bring the price to the yellow line and break through the support level of 90.64, and then start pushing the price towards the lower support level of 78.91, which is located on the lower green line. If this scenario is confirmed, we can consider opening sales transactions.
Alternatively, an upward movement of the market is assumed. In this case, in the near future, the market may grow to the resistance level of 100.64, which is located on the upper green line. The continuation of the upward trend is possible in the event of a breakdown of the specified level, then the bulls will open the way to the upper yellow line and the resistance level of 110.94. When confirming this scenario, it is worth considering opening deals for purchases.


