


The NDX100 stock index suggests the formation of a large horizontal trend that zigzags inside the green channel with a slight downward slope.
The Nasdaq suffered its steepest weekly percentage drop since February 2021, with the Dow and S&P 500 posting double-digit losses. On Friday, stocks fell in reaction to the December U.S. employment statistics missing expectations, although it was still considered good enough to keep the Federal Reserve’s rate increase path intact.

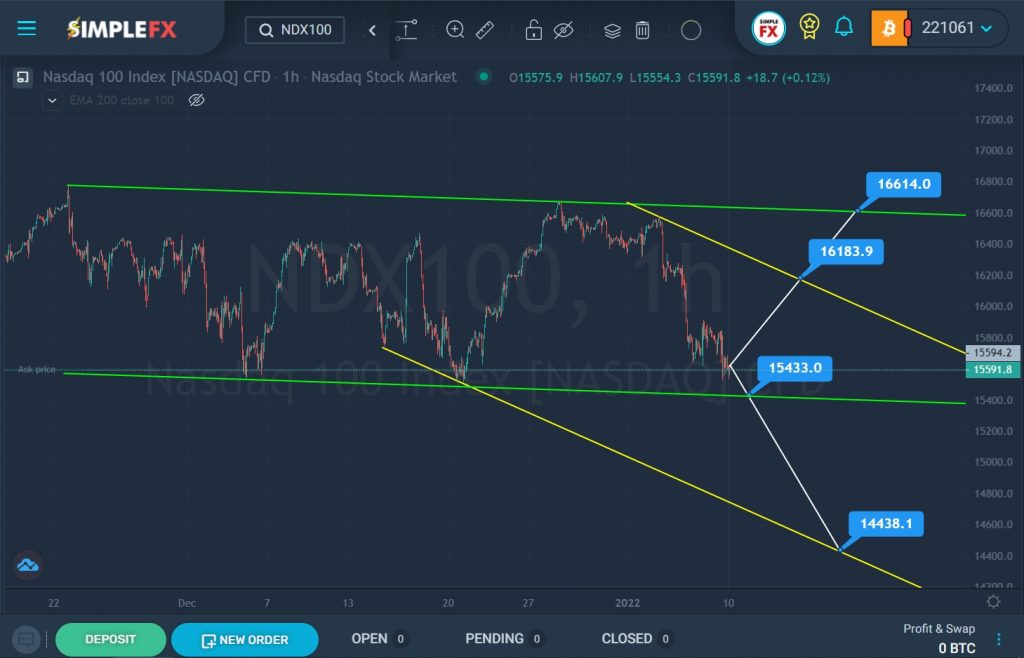
There is a high probability that in the near future the market will form a downward trend inside the new yellow channel, as shown in the chart. To confirm this forecast, bears must break through the lower green wall. Currently, the market is in the lower green area, so the bears have every chance to bring the market to the support level of 15433.00, and then break through it. In case of a breakdown of the specified level, the downtrend will be confirmed, and the price will begin to fall to the lower yellow wall and the support level of 14438.1.
If the lower green line is not broken, then the market can push off from it and the formation of a horizontal trend will continue. In this case, growth is assumed in the direction of the upper yellow wall and the resistance level of 16183.9. If this price level breaks, the index may rise to the next resistance level of 16614.0, which is located on the upper wall of the green channel.
With a downward price movement, it is worth thinking about sales. When confirming a bullish movement, it is recommended to consider opening deals for purchases.


