


The formation of the USDCAD currency pair suggests the construction of a global uptrend that moves inside a large green channel. The 1H timeframe shows a section of the market movement since the end of October of the previous year.

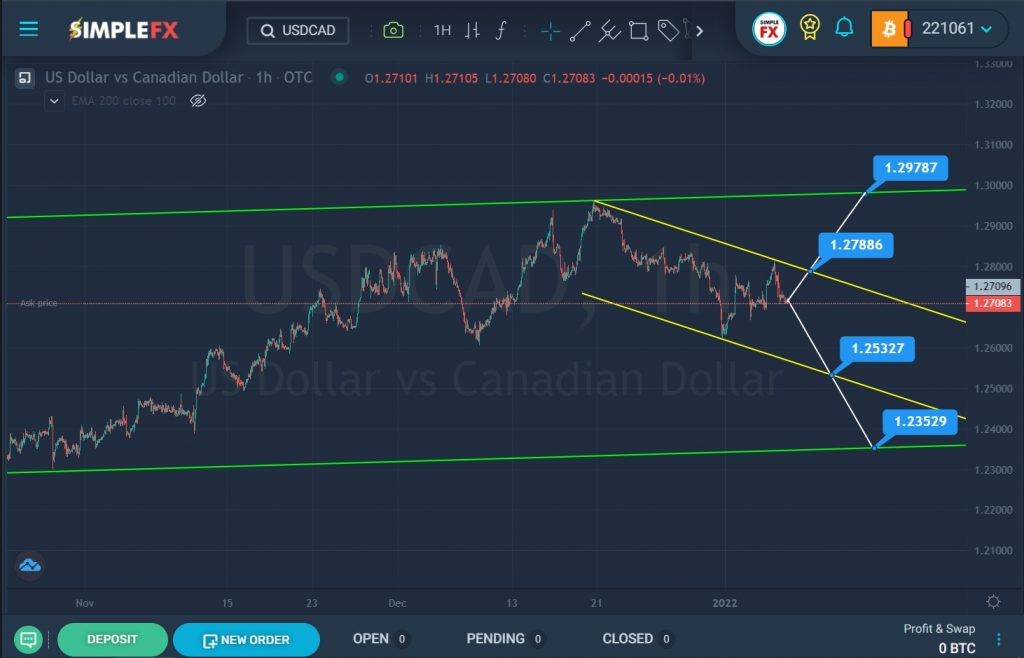
SimpleFX USDCAD Chart Analysis: January 7, 2022
In the last section of the chart, we see a downward movement of the price from the upper green wall in the direction of the lower green wall within the yellow channel. Currently, the price is near the upper yellow line. There is a possibility that soon the bulls will break through the upper yellow line near the resistance level of 1.278. If this price level breaks, it will open the way for them to a higher resistance level of 1.297, which is located on the upper green line.
Alternatively, it is assumed that the market will start moving in a downward direction. Most likely, the price will drop to the support level of 1.253, which is located on the lower yellow line. If the bears still have strength left, they can try to break through the yellow line. With a successful breakdown of this level, market participants are waiting for the continuation of the downward movement to the lower green wall and the support level of 1.238.
If the bullish movement is confirmed, it is possible to consider opening deals for purchases, with a bear market, it is worth considering opening deals for sales.


