


The current formation of the USDJPY currency pair suggests a global bullish trend that moves within the green channel.

After the last pullback from the upper green wall, which was at the end of November, we saw a rapid drop in impulse form to the lower green line. In a short time, the price reached the green line, but the bears could not break through it. Thus, the market turned around and began to gradually move in a horizontal direction with a slight upward slope.
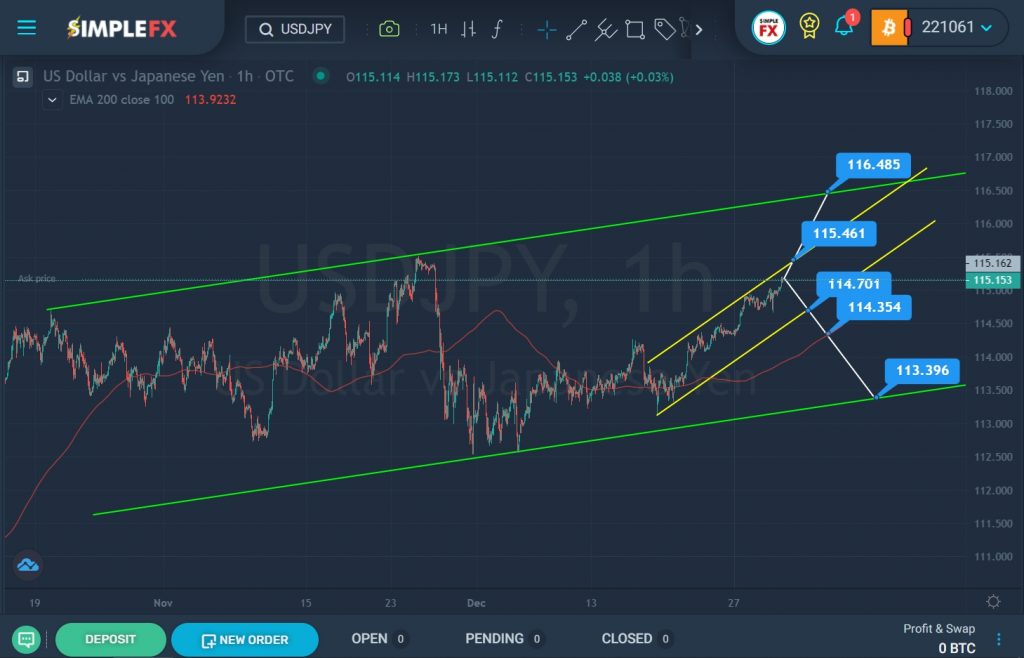
However, recently bulls have started to push the price up more actively. This section describes a small yellow channel. Most likely, with the same growth rate, bulls will be able to break through the resistance level of 115.46, located on the upper yellow line. In this case, market participants are waiting for an increase to a higher resistance level of 116.48, which is located on the upper green line.
If the bulls fail to break through the upper yellow wall, then the price may push off and start moving in a downward direction to the lower yellow line. With a successful breakdown of the support level of 114.35, the bears will open the way to the lower green line and the support level of 113.39. But on the way to the green line, the bears have another obstacle – the resistance level of 114.54, which is on the moving average.
Therefore, the bear needs a lot of strength to hold its position.


